You start a live stream with a clear topic, a prepared offer, and a notification sent to your audience. The counter climbs, your excitement rises, and then the number stalls. Later, the public replay shows a different total, while the creator dashboard reports another set of figures. You're left asking the wrong question: “Which live view count is correct?”
The better question is, what did those viewers do after they entered? Did they stay, participate, click your offer, book a call, or buy? A raw count can tell you that activity occurred, but it can't tell you whether the audience paid meaningful attention or produced business value.
Why Your Live View Count Tells Only Half the Story
A live view count feels easy to understand because it appears as one visible number. During a broadcast, though, that number can represent different kinds of activity depending on the platform, the dashboard, and the point in time when you check it.
Consider a creator hosting a product demonstration. The counter rises quickly when the stream begins, reaches a peak during the main reveal, and then falls as people leave. The creator may interpret the decline as failure, even though the viewers who stayed could have generated more qualified interest than a much larger audience that watched briefly and disappeared.
The number is useful, but it's only one layer of the story. YouTube separates total live views from concurrent-viewer information, and its analytics system makes those distinctions visible in Studio shortly after a stream ends. YouTube's live analytics documentation describes concurrent viewers as the maximum number watching at one time, while views represent the total times the stream was viewed while live.
The counter changes meaning with context
A total live view figure answers a reach question: how much viewing activity did the broadcast attract while it was live? Concurrent viewers answer a presence question: how many people were watching at the same moment? Peak concurrent viewers answer a momentum question: what was the largest simultaneous audience?
None of those figures directly answers an outcome question. They don't show whether viewers understood the offer, trusted the presenter, clicked a link, submitted a lead, or purchased.
That's why creators who chase the highest possible number often make poor programming decisions. They may shorten a valuable explanation, create unnecessary controversy, or use a dramatic opening that attracts brief visits but fails to hold attention. A stream can produce an impressive spike and still perform weakly as a sales channel.
Practical rule: Treat the live view count as a starting signal, not a verdict on content quality.
The rest of the analysis should connect audience activity to behavior. Look for the moments that hold viewers, prompt questions, and generate clicks. A smaller but attentive audience can be more commercially useful than a larger crowd that never moves beyond the player.
The distinction also matters when you stream across several platforms. A figure reported by one service may reflect a player load, while another platform may define its total as views accumulated during the live session. Before comparing results, you need to know what each platform counts.
What Live View Count Actually Measures
The phrase live view count often bundles several metrics together. Separating them makes the numbers much easier to interpret.
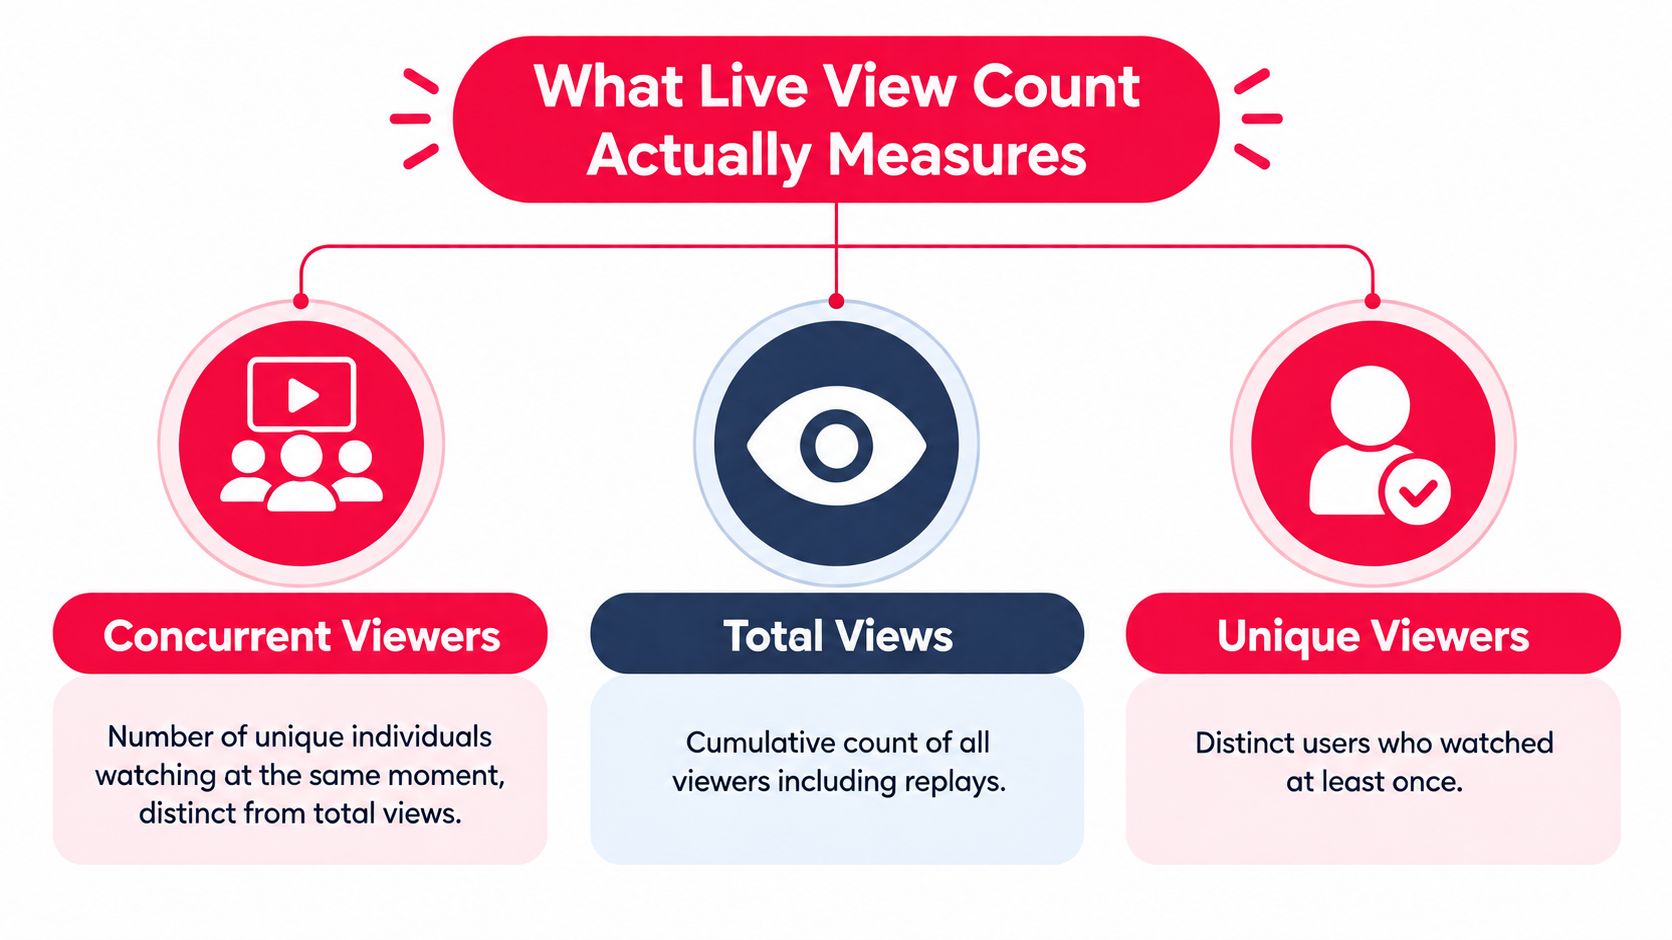
Think of a physical event held in a room. Concurrent viewers are the people inside at a particular moment. Peak concurrent viewers are the largest crowd present at any one time. Total live views are the accumulated entries recorded throughout the event, including people who arrived, left, and returned.
YouTube's terminology follows this logic. Its documentation defines concurrent viewers as the maximum number of viewers watching a live stream at one time and defines views as the total number of times the stream was viewed while live. YouTube also makes live analytics available in Studio, with concurrent-viewer reporting available at the video level within minutes after the broadcast ends. YouTube's explanation of live-stream metrics is the right reference when you're interpreting a YouTube broadcast.
Three numbers, three questions
Concurrent viewers tell you about the audience watching together. This is valuable for events built around shared timing, such as launches, interviews, live coaching, or breaking commentary. A strong concurrent audience can also make chat feel active, which may encourage other viewers to participate.
Peak concurrent viewers show the highest simultaneous audience reached during the stream. Use this metric to locate moments of concentrated interest. If the peak occurred during a demonstration, audience questions, or an offer explanation, that moment deserves closer review.
Total live views measure accumulated viewing activity while the stream is live. They don't necessarily represent unique people. One person can enter more than once, and a viewer who leaves early may contribute to the total without contributing much watch time.
The term unique viewers needs separate treatment. It refers to distinct users who watched at least once, whereas total views count viewing events under the platform's definition. The two figures can therefore tell very different stories. A high total paired with a much smaller unique audience may indicate repeat visits or multiple sessions, not broad reach.
Use the right metric for the decision
Match the metric to the decision you're making:
- Planning a shared event: Review concurrent and peak concurrent viewers.
- Evaluating reach: Review total live views and unique-viewer information where available.
- Improving content: Study retention, average watch time, chat activity, and engaged viewing.
- Measuring revenue: Track clicks, leads, bookings, and sales from the stream.
A storefront analogy helps here. A counter outside the shop can record people passing the entrance, while an indoor counter records people who enter. Neither tells you who examined a product or made a purchase. The live view count works the same way. It records an important stage in the audience journey, but it doesn't replace behavioral or conversion data.
How Major Platforms Count Live Views Differently
A creator simulcasts the same product demo on YouTube and Vimeo. Both dashboards show a similar live view count, yet one figure may represent player loads while the other represents views recorded during the broadcast. Treating those totals as interchangeable can make a campaign look stronger or weaker than it is, especially when the goal is clicks, leads, or sales.
Each platform defines and displays live metrics through its own reporting system. Record the platform and metric name before comparing results. A view may be triggered by a player loading, playback beginning, or a viewer entering the live broadcast. The reporting screen may also refresh separately from the underlying event data.
Vimeo, for example, defines total views as player loads and reports current viewers, peak viewers, and average time watched separately. YouTube defines live views as the total number of times a live stream was viewed while live. Vimeo's live analytics guide and YouTube's view calculation process provide platform-specific context for interpreting those figures.
Live View Count Comparison Across Platforms
| Platform | What Triggers a View | Concurrent Metric | Refresh Behavior |
|---|---|---|---|
| YouTube | Views represent the total times the stream was viewed while live. YouTube's public view rule also counts playback from the first frame. | Concurrent viewers and peak concurrent viewers are reported separately. | Public counters and analytics displays can update at different times. |
| Vimeo | Total views are defined as player loads. | Current viewers and peak viewers are reported separately, along with average time watched. | The dashboard presents separate live and total-view fields. |
| Twitch | Interpret the view figure through the metric label shown in Twitch's dashboard rather than assuming it matches another platform. | Use the platform's concurrent-audience reporting for simultaneous viewers. | Timing can vary between live interfaces and later analytics. |
| Read live reporting through Facebook's own labels and definitions. | Treat simultaneous viewers as distinct from accumulated views. | Public and internal reporting may update at different moments. |
The cautious wording matters. Where a platform's supplied definition does not establish a precise trigger, do not fill the gap with an assumption. For a client report, record the platform, stream, metric name, reporting location, and capture point.
Don't build reports from raw totals alone
Place each figure beside its definition. Compare average time watched with average time watched, or peak concurrent viewers with peak concurrent viewers, when both platforms provide comparable fields. Player loads and live-session views describe different stages of the audience journey.
Then connect viewing activity to business behavior. A large accumulated total may show that a player loaded repeatedly, while clicks reveal whether viewers responded to the offer. Leads and sales show whether that attention produced revenue.
A reliable cross-platform report should answer four questions:
- Which platform produced the figure?
- What triggered the recorded view?
- Is the number cumulative, simultaneous, or unique?
- Was it captured during the stream or after processing?
Without those labels, stakeholders can compare different measurements while believing they are reviewing the same KPI.
Why Live View Counts Fluctuate and Discrepancies Appear
Your stream can attract a surge of clicks while the public counter still shows yesterday's picture. A live count is a moving signal, not a perfectly synchronized record, so it may rise, pause, fall, or differ from the creator dashboard without indicating a technical problem.
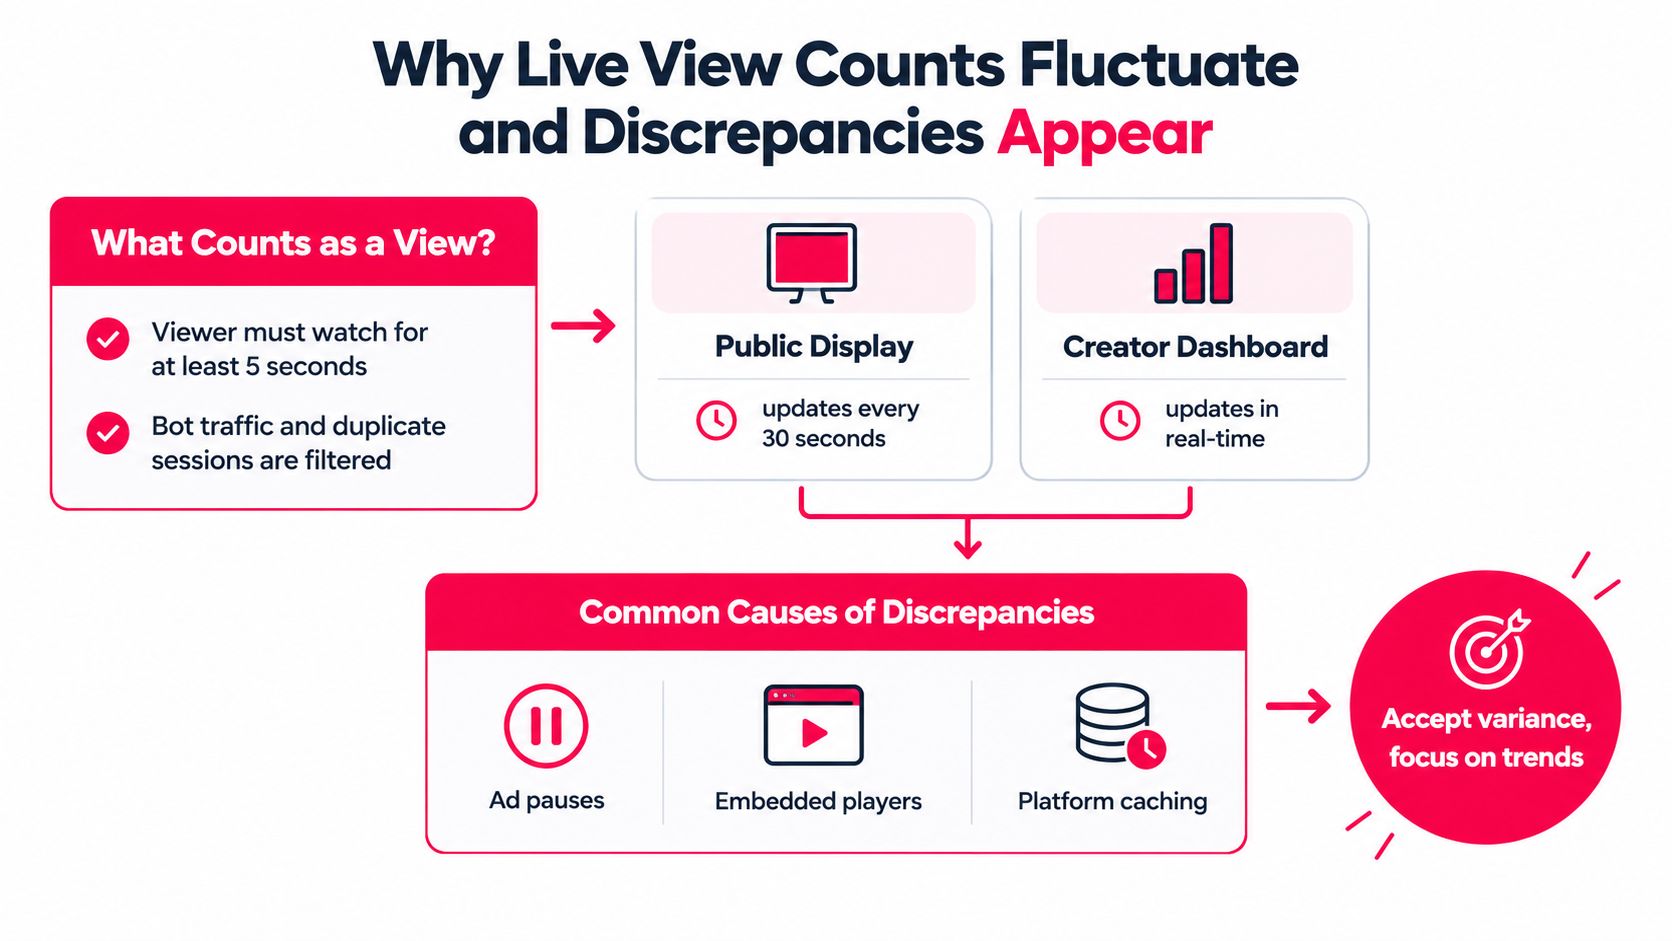
External counters usually refresh on a short cycle. That delay separates activity inside the platform from the number shown on a public page. During a sudden audience surge, new sessions may already be processed while the visible counter still reflects an earlier state. YouTube's live metrics reference distinguishes total live views from the instantaneous audience watching at a given moment.
Four normal causes of movement
Audience turnover explains much of the movement. Viewers may join for the opening, leave when the subject changes, and return for a later segment. Accumulated views can keep increasing while concurrent viewers decline, much like a shop's daily visitor total can rise even as the number inside falls.
Dashboard timing creates another difference. A public page may refresh on one schedule, while Studio or an internal analytics panel processes events through another. The figures can align later without either display being incorrect.
Playback behavior also affects the total. YouTube's public-view rule counts a view for long-form videos, live streams, and podcasts when playback begins or when a viewer enters the live broadcast, without a minimum watch-duration requirement for that public count. The change took effect globally on August 24, 2026, according to YouTube's public-view update.
Embeds and repeated sessions add further variation. A stream embedded on a website can attract viewers who are less visible in the platform's main community. Refreshing a page, changing devices, or re-entering the broadcast may create additional sessions under the platform's rules.
Separate signal from noise
A single drop is weak evidence. Compare concurrent viewers, watch time, chat activity, and retention. If only the public counter changed, timing or counting behavior may explain it. If engagement indicators also weakened, examine stream quality, pacing, content, and promotion.
Creators also ask whether watching their own stream changes the reported figure. The answer depends on the platform and reporting context, so consult this explanation of whether YouTube counts your own views instead of inferring an answer from the public counter. Then judge the number by its business trail: clicks, leads, and sales carry more decision-making value than a counter that merely moved.
Read fluctuations as patterns. One refresh is anecdotal. Repeated behavior across streams is evidence you can act on.
Why Live View Count Matters for Discovery and Revenue
A stream can show a crowded counter while producing few clicks, leads, or sales. Another broadcast may attract fewer concurrent viewers yet reach people who need the offer and are ready to act. Live view count matters because people must enter before any business result can occur, but entry is only the first checkpoint.
YouTube now counts a view from the first frame of playback across long-form videos, Shorts, podcasts, and live streams, while analytics keeps a separate engaged views metric. Forbes' coverage of the YouTube view-count change highlights the practical distinction: the public number can increase early, while engaged viewing gives a clearer indication that someone continued watching.
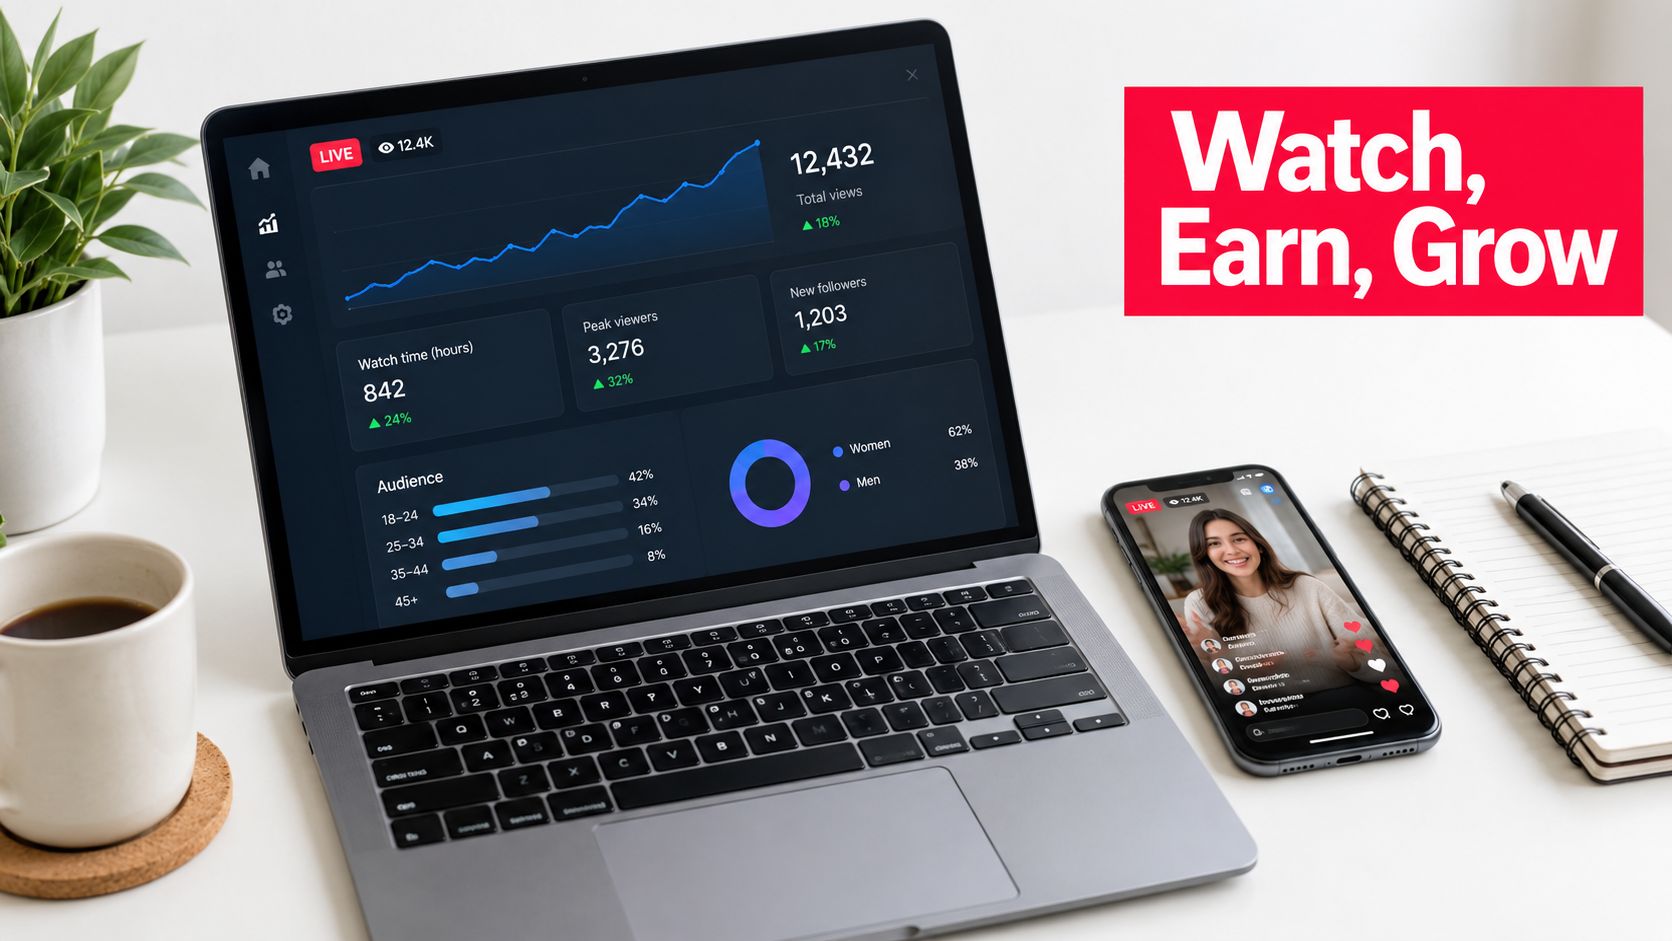
Read performance as a funnel, like a shop where each doorway leads to a deeper commitment:
- Entry: Did people start playback or enter the broadcast?
- Attention: Did they stay long enough to understand the content?
- Interaction: Did they comment, answer a poll, ask a question, or subscribe?
- Intent: Did they click an offer, visit a booking page, or request information?
- Outcome: Did they become a lead or customer?
The raw count measures the doorway. Revenue usually depends on what happens after people walk through it.
Connect the stream to a measurable action
Give viewers one clear next step, such as a product link, consultation form, course page, or event registration. Create a distinct trackable link for the broadcast and place it where viewers can find it in the description, chat, or related posts.
ViewsMax can create trackable offer links and connect clicks, leads, and attributed sales to the content that generated them. You can then compare audience size with commercial response, rather than treating concurrent viewers as a substitute for revenue.
This changes content decisions. A modest peak can outperform a larger broadcast when it attracts the right audience and presents a relevant reason to act. A high live view count may show that promotion worked, while saying little about whether viewers understood or wanted the offer.
The video below presents another way to connect content activity with measurable performance.
Use public views to assess distribution, engaged views and retention to assess attention, and attribution data to assess business impact. Sponsorship discussions, content planning, and budget decisions become clearer when these layers remain separate.
Actionable Strategies to Grow and Retain Live Viewers
Growing a live audience isn't only about attracting more people at the start. You also need to give viewers a reason to stay, participate, and return for the next broadcast.
Before the stream
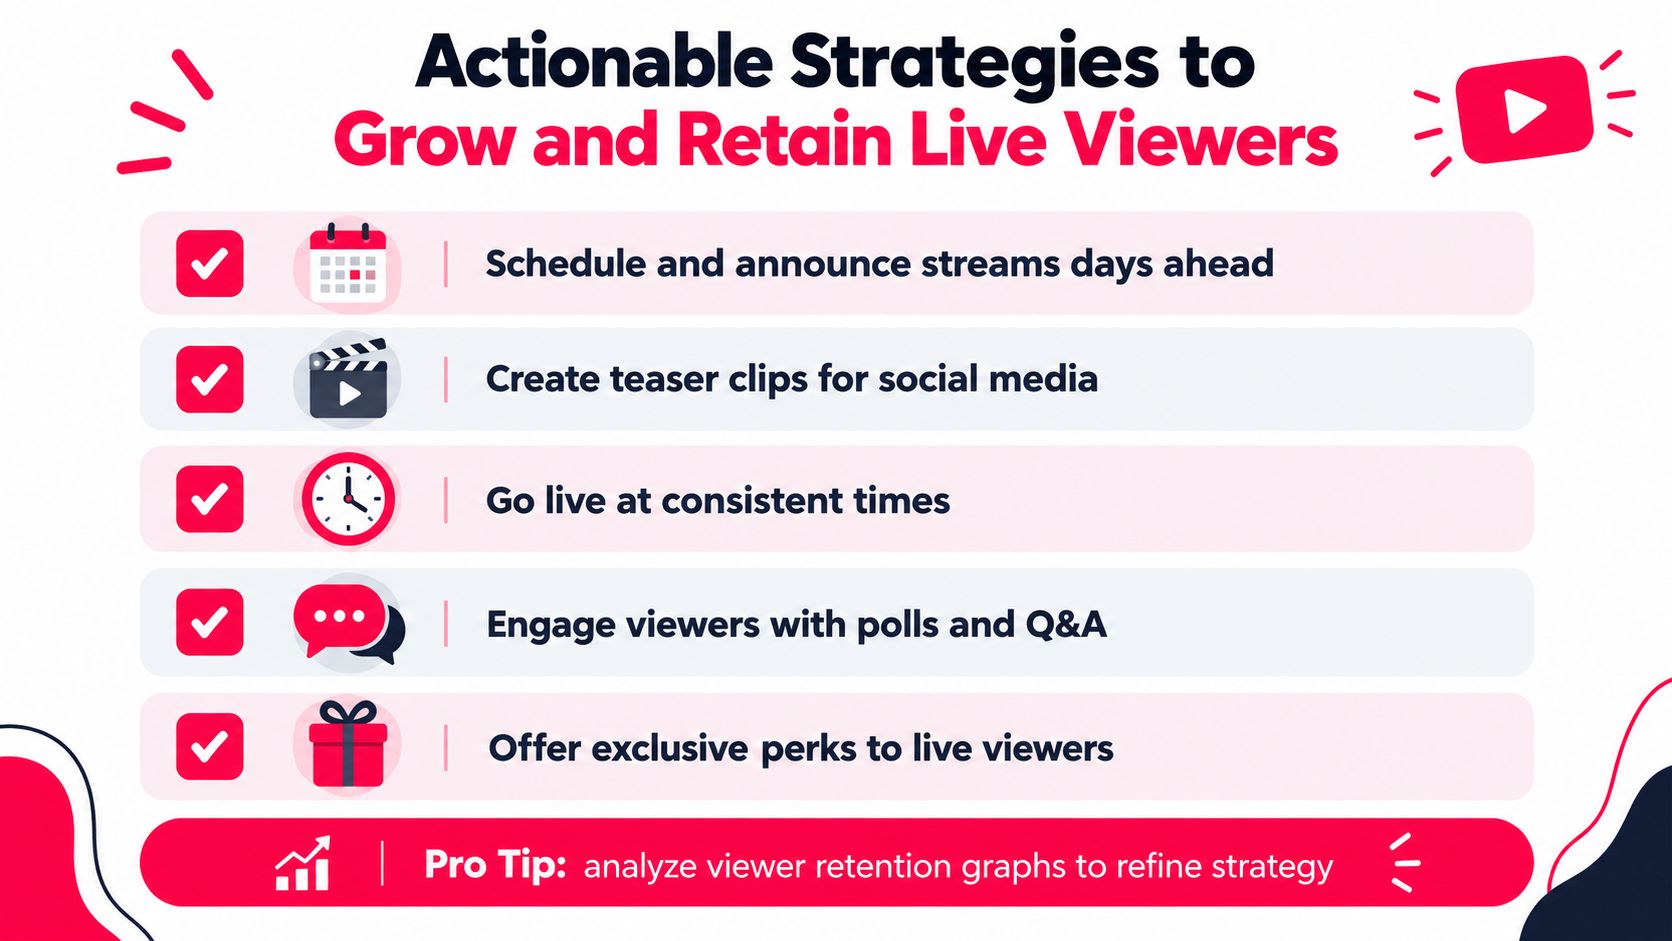
Start promotion early enough for the event to become part of your audience's plans. Announce the topic, promise a specific outcome, and make the start time easy to find. A vague message such as “I'm going live soon” gives people little reason to rearrange their attention.
Use a short teaser clip to show the question, mistake, demonstration, or result that the broadcast will address. Share the clip on your other channels, then repeat the reminder close to the start. If you publish on a consistent schedule, viewers can build the habit without needing to rediscover your broadcast each time.
During the broadcast
The first moments should orient viewers who arrive late. State the topic, explain what they'll get, and tell them when the most important segment is coming. Don't spend the opening in technical silence while people wait for the host to begin.
Then create participation points:
- Ask focused questions: Invite viewers to choose between clear options rather than requesting general comments.
- Use polls and Q&A: Interactive prompts give passive viewers a low-friction way to participate.
- Acknowledge useful contributions: Respond to questions by name when appropriate, then connect the answer to the wider lesson.
- Repeat the core offer: Latecomers need the context and call to action that earlier viewers heard.
Pacing protects retention. Prepare transitions, switch visual elements when the topic changes, and remove dead air wherever possible. A recurring segment can also give returning viewers a reason to attend live instead of waiting for the replay.
After the stream
Review the retention graph and identify where viewers left, stayed, or became active. Match those moments against your outline. A long drop during setup may signal that the opening needs tightening, while a sustained section around a demonstration can guide your next broadcast.
Repurpose strong moments into clips and short-form posts. Each clip should have its own context and a clear invitation to the next live event. Don't merely publish a highlight. Explain why the moment matters and what viewers can expect if they attend the full broadcast.
Retention is a programming tool. Use audience drop-off points to redesign the next stream, not to criticize the last one.
A repeatable cycle looks like this:
- Schedule the event and publish a specific promise.
- Promote a teaser that creates a useful question.
- Open with orientation and immediate value.
- Build interaction into the outline.
- Deliver one clear action for interested viewers.
- Study retention and conversions after the broadcast.
- Turn the strongest segment into promotion for the next event.
Building a Live Stream Monitoring Framework
A useful monitoring framework combines reach, attention, participation, and revenue. It prevents the live view count from dominating the review because it's the easiest figure to see.
Start with the audience picture. Record total live views, concurrent viewers, peak concurrent viewers, and unique viewers where the platform provides them. Keep the platform and reporting time beside each metric, especially when you publish across YouTube, Vimeo, or another service.
Then examine attention. Review average watch time, retention patterns, and engaged views. Ask whether the audience stayed through the explanation that mattered most. A peak audience during an entertaining opening may be less valuable than steady attention during the section that explains the product or solves the viewer's problem.
A post-stream review checklist
- Audience timing: Did the largest simultaneous audience appear during the intended key moment?
- Retention: Where did viewers leave, and what was happening on screen?
- Participation: Which questions, polls, or demonstrations produced the strongest response?
- Action: Did viewers click the designated link or complete the next step?
- Commercial result: Did the broadcast generate leads, bookings, or sales that can be attributed to it?
- Platform context: Are cross-platform figures based on comparable definitions?
- Next adjustment: What single programming change should you test in the next stream?
The wider market makes this discipline more important. Industry summaries based on Streams Charts data report roughly 120 billion hours of live content watched across major platforms in 2025, while another industry summary reports 36.4 billion hours of total live-streaming viewership in that year, compared with 37.1 billion hours at the pandemic peak in 2021. These summaries use different scopes, so they shouldn't be treated as interchangeable totals. The live-streaming market overview also reports that YouTube Live accounted for about 56 billion hours, around 47% of the market, with TikTok Live near 35 billion hours and Twitch around 18 billion hours in 2025.
Large attention markets create more opportunities, but they also make vanity reporting easier. For teams selling software or services, a resource such as SaaS analytics strategy by Prometheus Agency can help frame the broader measurement problem around acquisition, activation, and revenue rather than isolated traffic totals.
For a practical reference on interpreting channel performance, review YouTube view statistics, then build your own stream report with the same definitions every time. The goal isn't to eliminate every discrepancy. It's to make each decision from a consistent chain of evidence, from viewer entry to business outcome.
Use ViewsMax to create trackable offer links, publish your live content across channels, and connect every click, lead, and sale to the stream that generated it. Start measuring your broadcasts as revenue channels, not just counters, so your next content decision reflects what converts.