Pinkfong's “Baby Shark Dance” has about 17.3 billion views, while the next two videos in YouTube's all-time ranking, CoComelon's “Wheels on the Bus” and Luis Fonsi's “Despacito,” sit at roughly 9.0 billion each, according to TubeAnalytics' ranking of the most-viewed YouTube videos. The gap is measured in billions, not millions.
That disparity changes how creators should think about YouTube video rankings. Ranking isn't a contest for the highest view count, and YouTube doesn't choose recommendations by sorting every upload from most viewed to least viewed. Its system first finds plausible candidates, then evaluates which candidate is most likely to create a satisfying viewing session for a particular person.
For revenue-focused creators, that distinction matters. A ranking win that produces views but no qualified clicks, leads, or sales may be less valuable than a smaller discovery win that reaches the right audience. The practical question isn't only, “How do I rank higher?” It's, “Which ranking signals create the kind of attention my business can convert?”
The Scale of YouTube Rankings Today
The upper end of YouTube's ranking system is almost impossible to comprehend through ordinary creator benchmarks. “Baby Shark Dance” leads the all-time list with about 17.3 billion views, while “Wheels on the Bus” and “Despacito” are each around 9.0 billion views. The leader therefore has nearly twice the views of either title below it, a sharp example of how concentrated the top of the platform can become. (TubeAnalytics)
That concentration didn't appear overnight. The first video to reach 1 billion views was Psy's “Gangnam Style” in December 2012. By January 13, 2022, “Baby Shark” had become the first video to reach 10 billion views, and independent 2026 rankings report that more than 30 videos had crossed 4 billion views, with 14 surpassing 5 billion. (Likes.io's historical summary)
Why the top of the list looks different
The historical pattern also reveals a shift in what sustains attention. Since Lady Gaga's “Bad Romance” reached the top of YouTube's all-time most-viewed ranking in April 2010, every later video to claim that position has been a music video. Children's content now occupies several leading positions, suggesting that repeatable, family-friendly formats can generate viewing across years rather than depending on a short viral burst. (Likes.io)
That doesn't mean a new educational channel must compete with “Baby Shark.” All-time rankings measure cumulative reach, while search and recommendation systems evaluate a video in the context of a viewer, a topic, and competing candidates. A specialist tutorial can rank for a valuable query without approaching the lifetime scale of global music or children's content.
The useful comparison isn't your video against the biggest video on YouTube. It's your video against the alternatives shown to the same viewer.
A safer way to read ranking data
The table below uses only the verified all-time ranking facts available here. It doesn't claim an average for ordinary channels or a percentage share of platform views, because those figures aren't established in the supplied evidence.
| Channel Tier | Avg. Lifetime Views | % of Total Platform Views |
|---|---|---|
| All-time leader, “Baby Shark Dance” | About 17.3 billion | Not established |
| Next two all-time titles | Around 9.0 billion each | Not established |
| Broader top tier | More than 30 videos above 4 billion views | Not established |
| Typical new or niche upload | Varies by channel and topic | Not established |
The scale can feel discouraging, but it also clarifies the opportunity. YouTube's recommendation model doesn't need every creator to become a global hit. It needs enough evidence to decide that a particular video is relevant and satisfying for a particular audience. Creators who understand that decision process can replace superstition with measurable experiments.
How the YouTube Recommendation Engine Actually Works
YouTube's recommendation architecture is easier to understand as a two-stage funnel than as a single mysterious algorithm. The first stage generates a manageable set of possible videos. The second stage ranks those candidates using detailed information about the viewer and the videos. This structure is described in Google's technical paper on deep neural networks for YouTube recommendations.
Think of a librarian serving a reader. The librarian doesn't evaluate every book in the building in the same depth. First, the librarian pulls a smaller shelf of books that match the reader's interests. Then the librarian studies that smaller group and chooses which books to place directly in front of the reader.
Stage one, candidate generation
The candidate-generation network narrows a very large video corpus using signals connected to user context. Those signals can include a viewer's watch history, previous interactions, and the relationship between videos watched by similar audiences. The output is not the final recommendation. It's a pool of plausible options.
For a creator, this stage answers a basic question: Can YouTube identify the people and topics your video might fit? Titles, descriptions, spoken content, thumbnails, and channel context help provide that fit. A video with unclear subject matter may struggle to enter the right candidate pool, even if the production quality is strong.
Stage two, ranking
The ranking network then scores each candidate with a richer feature set describing the video and the viewer's current context. Google's research states that the system is optimized around predicted watch time, which means a click matters because it may lead to a longer viewing session, not because the click itself is the final objective. A compelling thumbnail that attracts the wrong audience can therefore create a weak downstream result.
A video can pass candidate generation but lose in the ranking stage. It may be relevant enough to appear among possible recommendations, yet fail to win the final placement because viewers leave quickly or respond poorly. Conversely, a well-satisfied audience can help a clearly positioned video compete for additional exposure among related viewers.
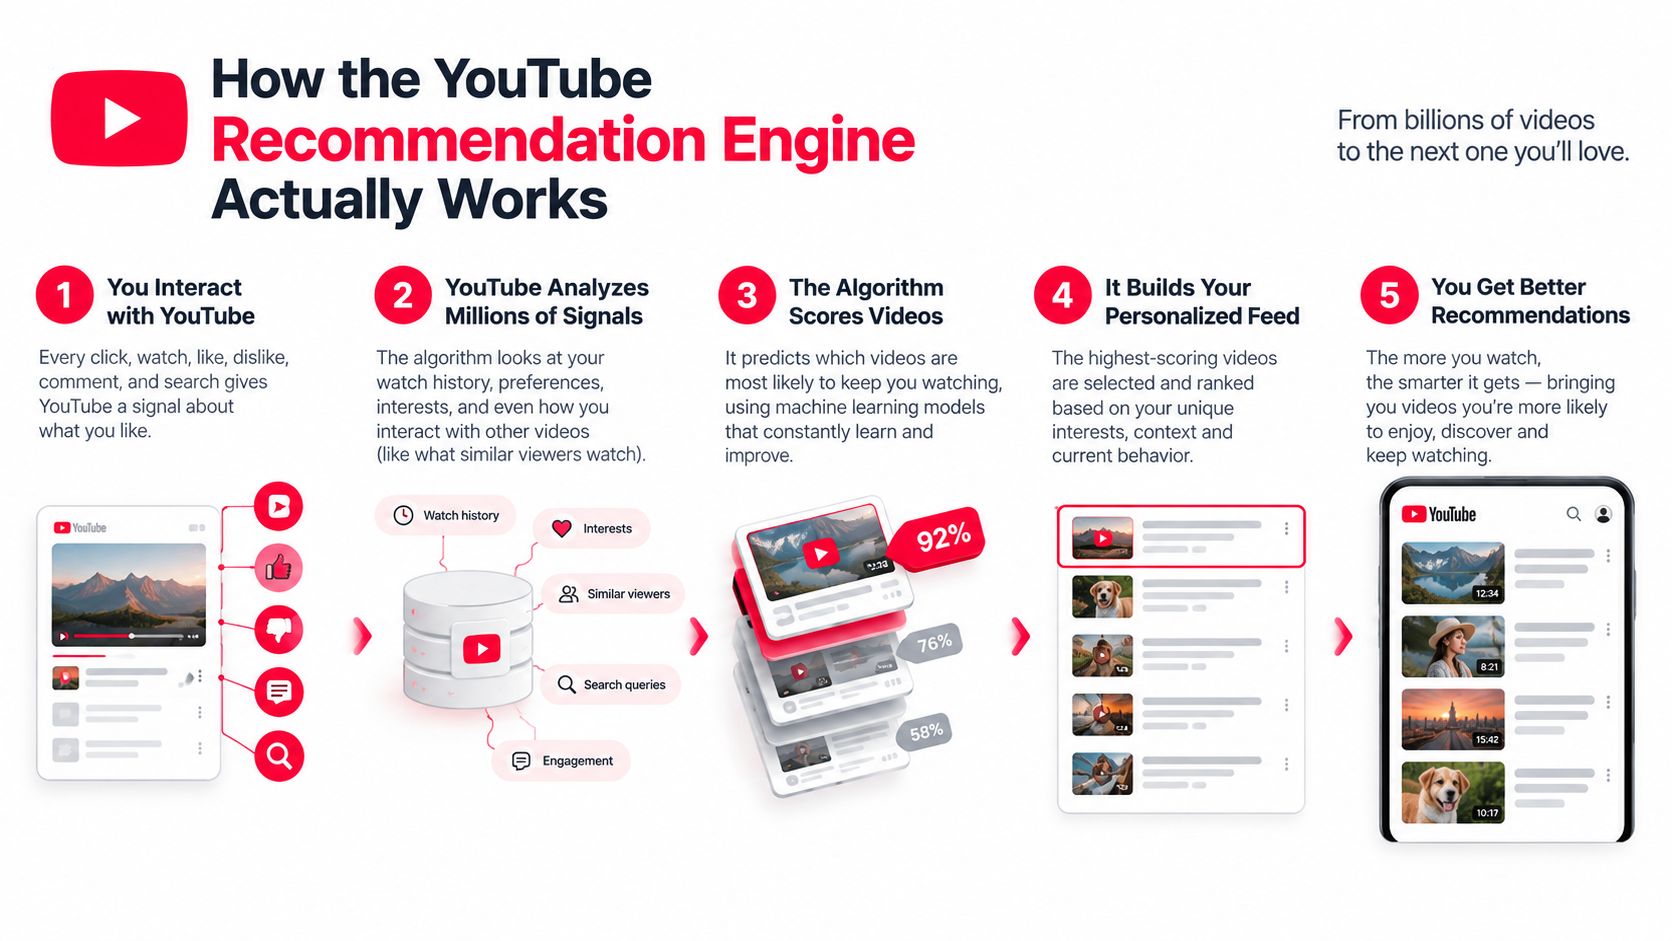
This is why metadata and audience response shouldn't be treated as competing strategies. Metadata helps YouTube understand where to test a video. Viewer behavior helps determine whether the test should expand. Creators looking for a broader overview of how platform changes affect distribution can also review this YouTube algorithm change guide.
The same distinction applies to monetization. Once a video earns discovery, the creator still needs a path from viewing to action. For a practical explanation of how paid and organic discovery can support that path, see Wojo Media's guide to turn browsing intent into conversions.
The Ranking Signals That Move the Needle
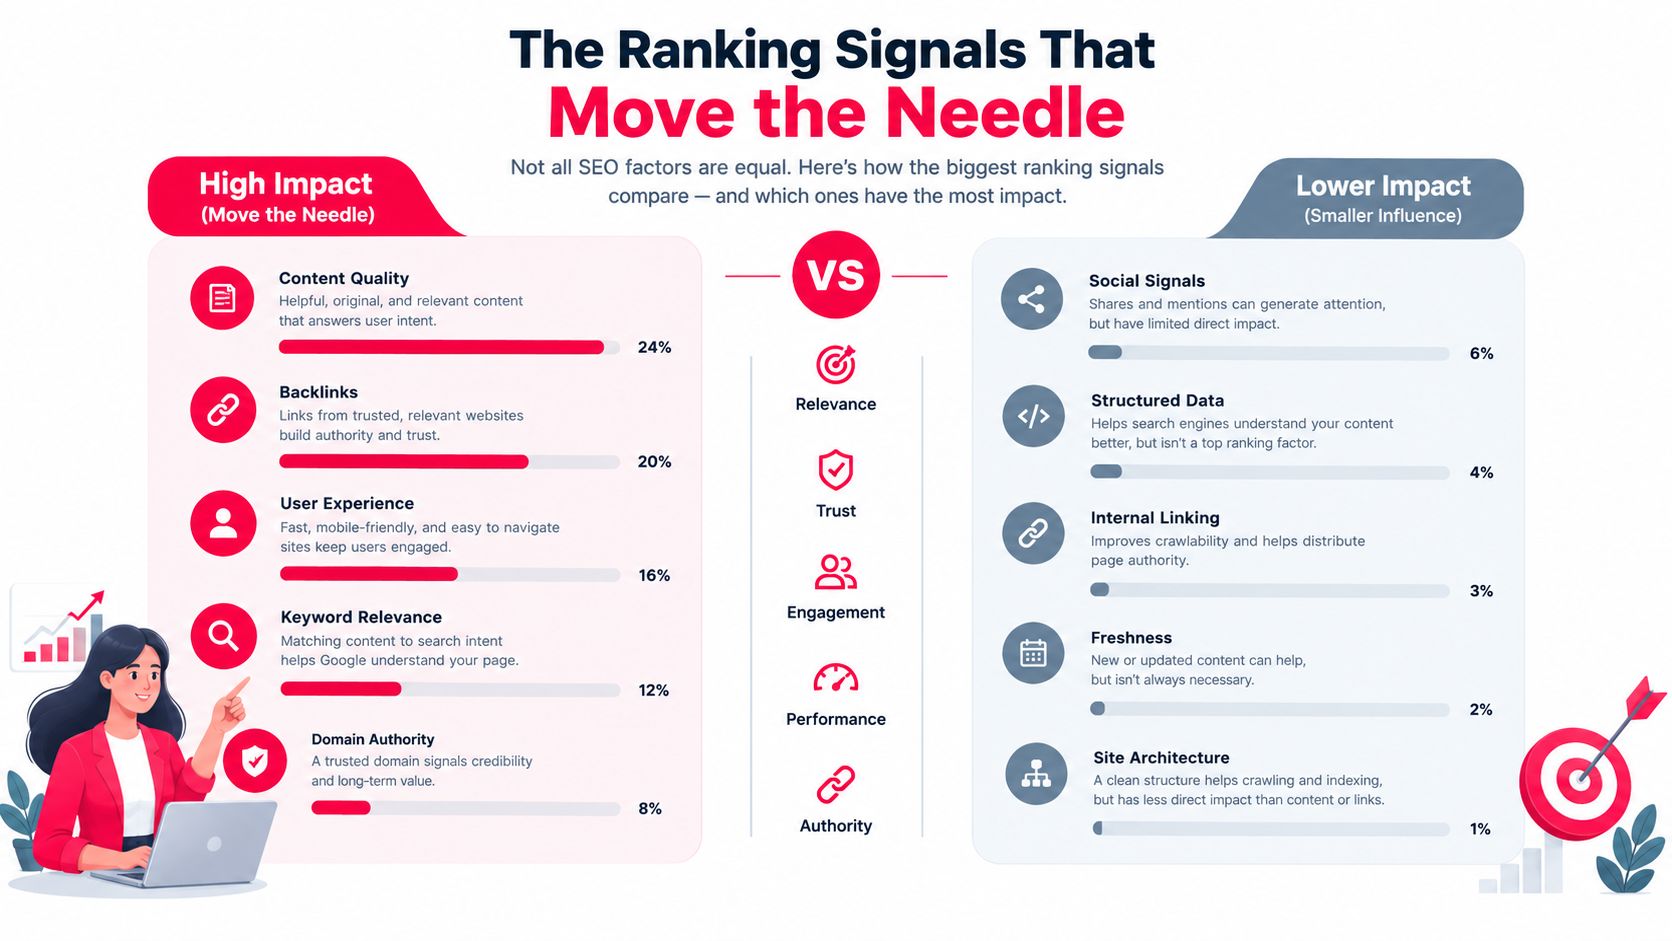
The most useful way to read YouTube ranking signals is as a sequence. Relevance gets a video considered. The click creates an opportunity. Watch behavior and satisfaction determine whether that opportunity becomes durable distribution. No single dashboard number explains the entire process.
Click appeal starts the test
A title and thumbnail create the first decision. If the packaging doesn't communicate a clear reason to watch, the video may receive fewer opportunities to prove its value. But a high click-through rate isn't enough by itself. Google's description of the recommendation system makes clear that the deeper ranking stage is concerned with predicted viewing time and user context, not clicks in isolation. (Google Research)
The practical implication is simple. Your thumbnail should make a promise that the opening delivers. A dramatic image paired with a vague or exaggerated title can generate curiosity, but if viewers leave after discovering the mismatch, the initial click won't rescue the video.
Retention gives the click meaning
Average view duration measures how long viewers watch. Percentage viewed measures how much of the video they consume relative to its length. A longer upload can produce more minutes per viewer, but only if the structure earns those minutes. Padding a script creates more opportunities for viewers to leave.
The supplied SEO analysis found that videos in the top positions averaged 2.65% engagement, compared with a 0.09% platform average, and that top-position videos averaged 358,000 views, versus 303,000 for second position and 292,000 for third. The same analysis found that 8 to 9 minute videos appeared in top positions most frequently. These figures are correlations, not guaranteed targets for every niche, but they show why format, engagement, and viewing behavior should be analyzed together. (Search Engine Journal)
Satisfaction adds the quality check
Satisfaction is broader than watch time. It includes whether people respond positively, continue watching related content, return to the channel, or signal that a recommendation wasn't useful. Recent industry discussion has focused on viewer satisfaction as a dominant consideration, but the evidence is contextual and mixed across formats, regions, and discovery surfaces. (OutlierKit)
A revenue-focused creator should therefore ask two questions after a ranking lift:
- Did viewers stay long enough to demonstrate value?
- Did the audience take a commercially useful next step?
Likes and comments can support the first answer, but they aren't revenue proof. A video can attract substantial discussion while reaching people who have no relationship to the creator's offer. Conversion tracking must sit alongside native engagement data.
| Older assumption | Better operating rule |
|---|---|
| Maximize raw watch time | Earn sustained viewing from the right audience |
| Make every video longer | Choose a length the topic can support without filler |
| Optimize for clicks alone | Align the title and thumbnail with the delivered experience |
| Treat engagement as the outcome | Measure engagement alongside qualified actions |
| Read ranking as a vanity metric | Connect ranking exposure to downstream business results |
The signal to improve first depends on the failure point. Low impressions with strong retention may indicate a relevance or packaging problem. Strong impressions with weak retention point toward a promise, pacing, or audience-fit issue. Good viewing behavior with no business action suggests the conversion path needs work.
Optimization Tactics You Can Apply This Week
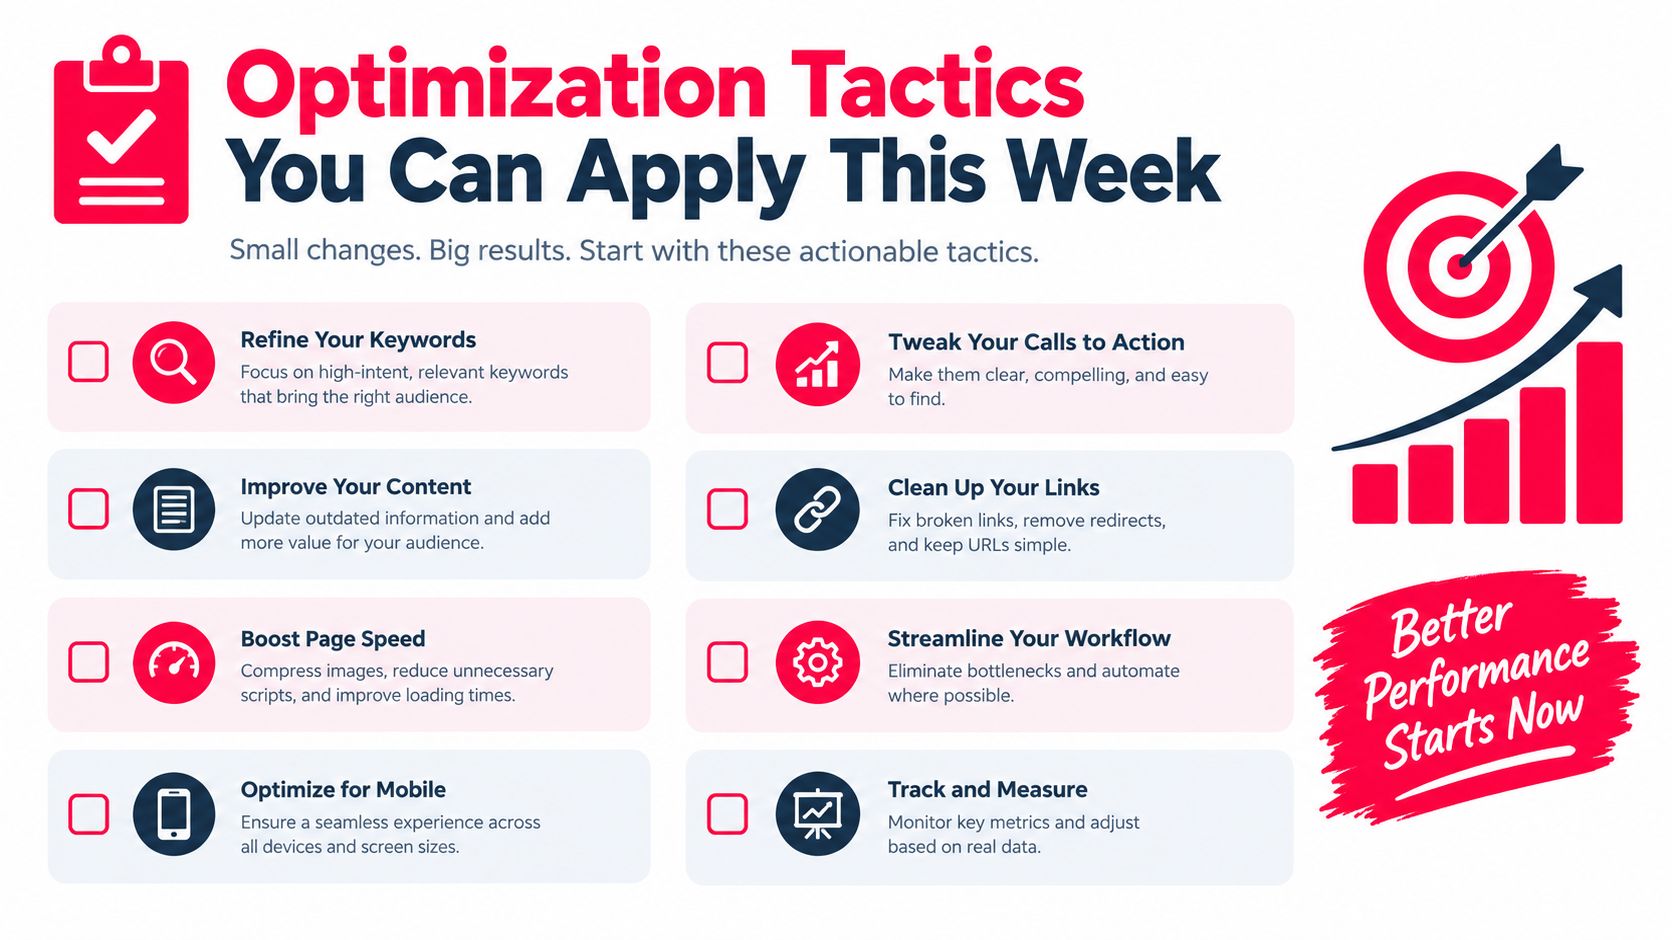
Optimization works best when each change has a specific job. Titles and descriptions clarify relevance. Thumbnails earn the click. The opening protects the promise. The middle gives viewers a reason to continue. You don't need to redesign the whole channel before publishing the next useful test.
Start with the promise
Write the title before finalizing the script. Lead with the viewer's intent, then add a specific outcome or tension. “YouTube Video Rankings Explained for Revenue-Focused Creators” tells the audience what the video is about, while “Why Your Ranking Win Isn't Producing Sales” creates a business consequence.
Use the description to reinforce that promise. Put a concise explanation in the opening lines, then add chapters with descriptive labels that reflect the questions viewers care about. Tags can act as a confirmation layer for topic context, but they shouldn't carry the discovery strategy on their own.
For a broader set of practical channel adjustments, use these YouTube SEO optimization tips as a planning reference.
Design the click before production ends
A thumbnail should remain legible when it's small. Use strong contrast, a clear focal point, and only the visual information needed to make the idea understandable. If text appears, keep it short enough to read without effort.
Test the title and thumbnail as a pair. Ask a colleague who hasn't seen the script what they expect from the video after seeing the package. If their answer doesn't match the actual lesson, the packaging is creating the wrong candidate audience.
Treat the opening as a contract
The first moments should answer three questions:
- What problem will this solve? State the outcome in plain language.
- Why should the viewer trust the video? Establish the relevant evidence or perspective quickly.
- What will keep the viewer watching? Tease the most useful step without delaying the first payoff.
A practical script pattern is: “If your videos rank but don't generate customers, this tutorial will show you where the funnel breaks. We'll start with the ranking signal, then connect it to the click and sale you can track. By the end, you'll have a review process for deciding which videos deserve more distribution.”
Cut logos, long greetings, and background information that doesn't serve that promise. The opening should feel like the video has already begun, because it has.
Protect the middle
Retention often weakens when the presenter repeats a point or changes topics without a visible transition. Use an open loop, a visual reset, or a chapter pivot to give the viewer a reason to stay oriented.
A screen recording can replace a static talking-head explanation. A simple diagram can clarify the relationship between impressions, viewing, and conversion. End each major idea with a clear next step rather than a generic transition. These edits improve the viewing experience without forcing a longer runtime.
Native Analytics Compared With ViewsMax Attribution
YouTube Studio and attribution software answer different questions. Studio explains what happened inside YouTube. Attribution explains which content interaction contributed to action outside YouTube. Treating one tool as a replacement for the other leaves a blind spot.
YouTube Studio is the right place to evaluate impressions, click-through rate, average view duration, audience retention, and traffic sources. It helps a creator decide whether the title needs work, whether the opening loses viewers, and whether a video is reaching audiences through search, browse, suggested content, or external referrals.
It doesn't, by itself, connect every viewer behavior to a completed external outcome. A creator may see that a video received more impressions and watch time, but still be unable to identify which video drove a consultation request, affiliate click, course purchase, or sponsor-linked action without a separate tracking layer.
What each tool can reveal
ViewsMax can sit on top of the content workflow by using trackable links for offers and connecting clicks, leads, and sales back to the content source. That makes it useful when the decision isn't only whether a video performed well, but whether the video helped produce a business result. ViewsMax is one option for creators who need planning, publishing coordination, and content-level attribution in the same operating process.
| Capability | YouTube Studio | ViewsMax Attribution |
|---|---|---|
| Impressions and click-through rate | Reports in-platform exposure and click behavior | Uses content and link activity to add downstream context |
| Watch time and retention | Shows how viewers behave during the video | Helps connect content interactions with tracked outcomes |
| Traffic sources | Breaks down where YouTube views came from | Attributes tracked clicks, leads, and sales to content or campaigns |
| External ad-spend connection | Limited for full revenue attribution | Supports campaign-level attribution when tracking is configured |
| Sponsor or offer reporting | Shows audience performance inside YouTube | Helps organize evidence of actions tied to a creator or campaign |
| Revenue visibility | Not a complete external sales ledger | Designed to show attributed business outcomes beside content performance |
Use Studio for in-platform creative decisions. Use attribution when you need to defend a budget, compare offers, or understand whether a ranking improvement brought buyers rather than only viewers. The two datasets become more useful when they're read together, especially alongside YouTube view statistics that help establish the reach and behavior context for each upload.
A Repeatable Workflow for Ranking and Revenue
A useful workflow begins before the camera turns on and ends after the revenue review. The creator's job is to maintain the loop, not to treat publishing as a sequence of isolated bets.
Research with a commercial question
Set aside a recurring research block to examine the language viewers use, the topics competitors cover, and the promises their thumbnails make. Shortlist ideas that match both audience intent and your offer. A video can be relevant to your niche yet commercially disconnected from what you sell, so label each idea with its likely next action before writing the script.
For each candidate, record:
- Viewer problem: What does the audience want to understand or accomplish?
- Ranking surface: Is the idea primarily suited to search, suggested content, or both?
- Business path: Which tracked page, offer, or follow-up video should receive interested viewers?
- Evidence to collect: Which Studio and attribution metrics will determine whether the idea worked?
Prepare the full package
Before publishing, finalize the title, thumbnail, opening promise, description, chapters, and end-screen destination as one system. The end screen shouldn't be an afterthought. It should continue the viewer journey established by the topic.
Make sure the external destination matches the video's promise. If the video teaches a process, the linked offer should help the viewer complete or extend that process. A mismatch can preserve views while weakening trust and conversion quality.
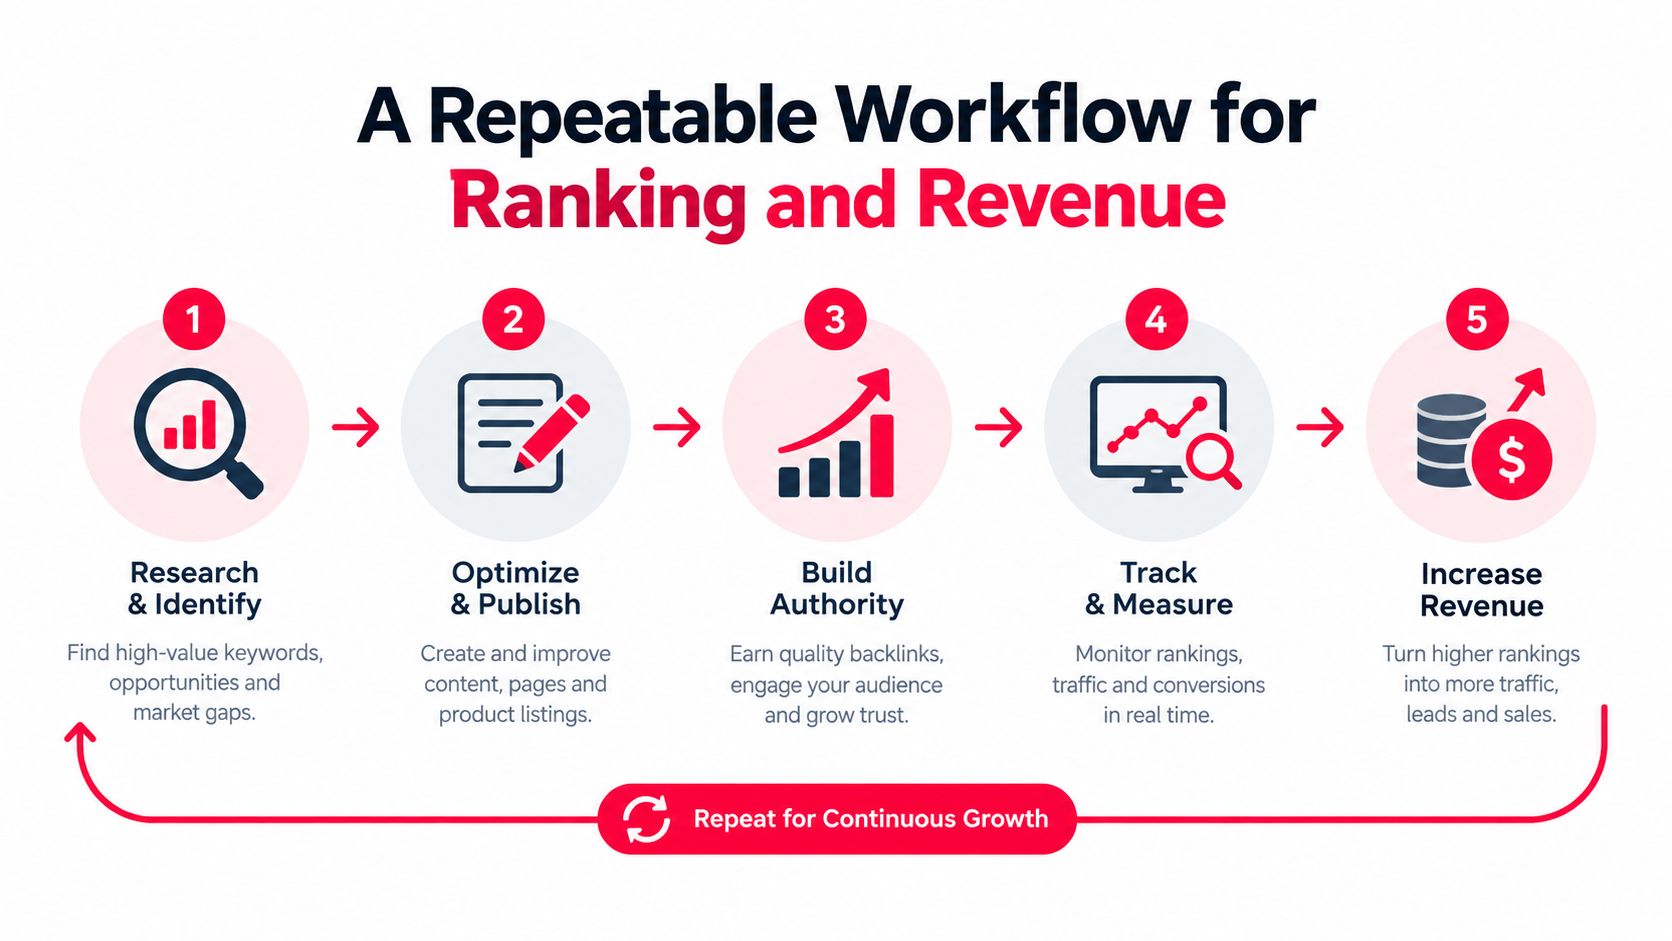
Review the launch as a diagnosis
Early performance should guide investigation, not trigger random changes. If impressions are available but clicks lag, test the packaging. If clicks arrive but viewers leave quickly, inspect the opening and the promise match. If viewing is healthy but external action is weak, review the call to action and destination rather than rewriting the thumbnail.
Record every change. Without a change log, you can't tell whether a result came from a new title, a different thumbnail, a distribution push, or normal variation.
Close the loop weekly
At the weekly review, compare ranking movement with attributed clicks, leads, and sales. A video that ranks well but attracts unqualified traffic may need a sharper audience promise. A modestly ranked video that repeatedly sends high-intent visitors may deserve more internal linking, paid support, or a sequel.
That's the core discipline. Optimize for the business outcome that ranking is supposed to create, not for the ranking screenshot itself.
Common Myths About the YouTube Algorithm
Myth one, new creators are automatically buried
New channels don't need an existing all-time audience to become candidates for discovery. The recommendation system's candidate-generation stage evaluates whether a video fits a viewer context, then the ranking stage evaluates how that candidate performs. That doesn't guarantee broad distribution, but it does mean a creator can compete through relevance and viewer response rather than relying only on historical fame. (Google Research)
Corrected rule: Make the topic legible and the promise specific enough for YouTube to test the video with a plausible audience.
Myth two, longer videos always rank higher
Length creates no automatic ranking advantage. Google's model focuses on predicted viewing time, while current research and industry analysis connect ranking with engagement, format alignment, and audience behavior. A concise tutorial that satisfies its audience can outperform a longer upload that delays the answer.
The supplied ranking analysis found that 8 to 9 minute videos appeared in top positions most frequently, but that observation isn't a universal runtime prescription. (Search Engine Journal)
Corrected rule: Choose the shortest structure that can deliver the promised outcome clearly, then use retention data to remove sections that don't earn their place.
Myth three, publishing more often guarantees growth
A faster schedule can produce more opportunities, but frequency doesn't compensate for weak topic fit, unclear packaging, or poor satisfaction. A creator who publishes repeatedly without reviewing retention and conversion data may repeat the same failure at greater speed.
There's also no reliable basis in the supplied evidence for claiming that a specific upload cadence, live-stream schedule, or posting volume guarantees ranking performance. Treat cadence as a production constraint, not as a magic signal.
Corrected rule: Publish at a pace that lets you research the topic, build a credible promise, review viewer behavior, and connect the result to the next commercial decision.
Turning Rankings Into Real Business Results
A ranking is a distribution event. Revenue appears only when that distribution reaches a relevant person, earns enough trust, and offers a clear next action.
The funnel starts with the impression. The title and thumbnail determine whether the viewer enters. The opening and structure determine whether the viewer stays. The lesson, product demonstration, or point of view determines whether the viewer believes the creator can help with the underlying problem.
That sequence explains why satisfaction signals matter to revenue-focused creators. A misleading package may create activity at the top of the funnel, but it attracts people who are less likely to trust the channel or take the intended next step. A well-matched video can produce a smaller audience with stronger commercial relevance.
Use ranking data as a decision system
Review each upload through four connected questions:
- Discovery: Did the video reach the audience and topic it was designed for?
- Viewing: Did the packaging and opening sustain attention?
- Intent: Did viewers click the relevant link, end screen, or next resource?
- Revenue: Did a tracked action lead to a sale, lead, booking, or other defined business result?
YouTube Studio is useful for the first two questions. A tracking and attribution layer is needed for the last two. The combination lets you distinguish a visibility problem from a conversion problem. It also helps you decide whether to improve the existing video, create a related follow-up, change the offer, or stop investing in that topic.
The next upload should reflect what the data taught you. Keep the elements that produced qualified attention, replace the ones that created mismatch, and preserve a clear record of the experiment. That's how YouTube video rankings become a repeatable revenue process rather than a vanity scoreboard.
ViewsMax helps creators plan content, publish across channels, and connect trackable clicks, leads, and sales back to the exact content that generated them. Visit ViewsMax to see how attribution can turn ranking and engagement data into clearer content and revenue decisions.