ViewsMax
Sign In Sign Up Free

Tag: youtube studio

  • YouTube Like Count: What It Means and How Creators Earn It

    YouTube Like Count: What It Means and How Creators Earn It

    You can watch a video collect thousands of likes and still have no idea whether it helped your channel, your audience, or your business. That's the gap behind the YouTube like count. The number is easy to see, but its meaning depends on what viewers did before the click, what they did afterward, and whether the interaction survived YouTube's filtering and reporting systems.

    A like is useful evidence, not a verdict. Treat it as a surface-level sign of approval, then compare it with retention, returning viewers, clicks, subscriptions, and revenue before deciding that a video connected.

    What the YouTube Like Count Really Represents

    A creator opens a video and notices that the visible count has changed. Sometimes it rises slowly, sometimes it appears to lag, and sometimes the expected number seems to have vanished from a familiar part of the interface. That experience can make the count feel like a direct audience reading, but it's better understood as a public-facing aggregate of one viewer action.

    A viewer presses the thumbs-up button. YouTube records that action against the relevant video and viewer account, then combines eligible interactions into the number shown on the public watch page. The count doesn't reveal which viewers liked the video, why they did it, or what happened during the rest of the viewing session.

    It also doesn't expose every piece of sentiment. Public dislike counts are no longer available, while creator-side dislike metrics remain accessible in Studio, creating a separation between what viewers can audit and what the creator can analyze internally. CNET's reporting on YouTube's public dislike change describes this asymmetry between public engagement signals and creator analytics.

    The action behind the number

    A like can mean several things:

    • Approval: The viewer enjoyed the video or agreed with its point.
    • Utility: The viewer found the tutorial, review, or explanation useful.
    • Support: The viewer wants to encourage the creator.
    • Participation: The viewer responded to a prompt or community habit.
    • Low-friction feedback: The viewer wanted to react without leaving a comment.

    Those meanings aren't interchangeable. A tutorial may earn likes because it solved a specific problem. A dramatic opinion video may earn likes because viewers agree with its framing. A short entertainment clip may receive a quick reaction without creating much lasting interest.

    That's why a like count shouldn't be read as a complete measure of satisfaction, loyalty, or buying intent. It tells you that eligible viewers selected the thumbs-up action. It doesn't tell you whether they watched to the end, returned for another upload, clicked a product link, or recommended the video privately.

    Practical rule: Use the public count to observe audience response, not to diagnose the entire audience experience.

    For a more structured way to compare likes with views and other interactions, use a YouTube engagement rate calculator. The important habit is to interpret the ratio alongside the underlying behavior, rather than treating the visible total as the result you're trying to maximize.

    How YouTube Records and Displays Likes

    A like moves through several surfaces before you see it in a dashboard. Understanding that path makes discrepancies less alarming.

    First, a viewer selects the thumbs-up control on the watch page. The same basic action can happen through a mobile gesture, a connected television interface, or another supported YouTube experience. The platform then processes the event and updates the relevant video-level aggregate.

    Second, YouTube reconciles the event with account status, platform rules, and filtering systems. A visible counter isn't necessarily an immutable ledger. YouTube may remove ineligible interactions, update totals after processing, or display information differently across public and creator-facing surfaces.

    Third, creators encounter the result in Studio. Studio can expose broader analytics than the public watch page, including creator-side dislike information and other performance details. Public viewers, by contrast, can directly inspect the like total but can't inspect the corresponding dislike total.

    The YouTube Data API v3 is another reporting surface. Developers can use YouTube's official API documentation and connected tools to request video statistics, but a third-party display may not refresh at the same moment as the watch page or Studio. A tool can also apply its own caching or reporting schedule.
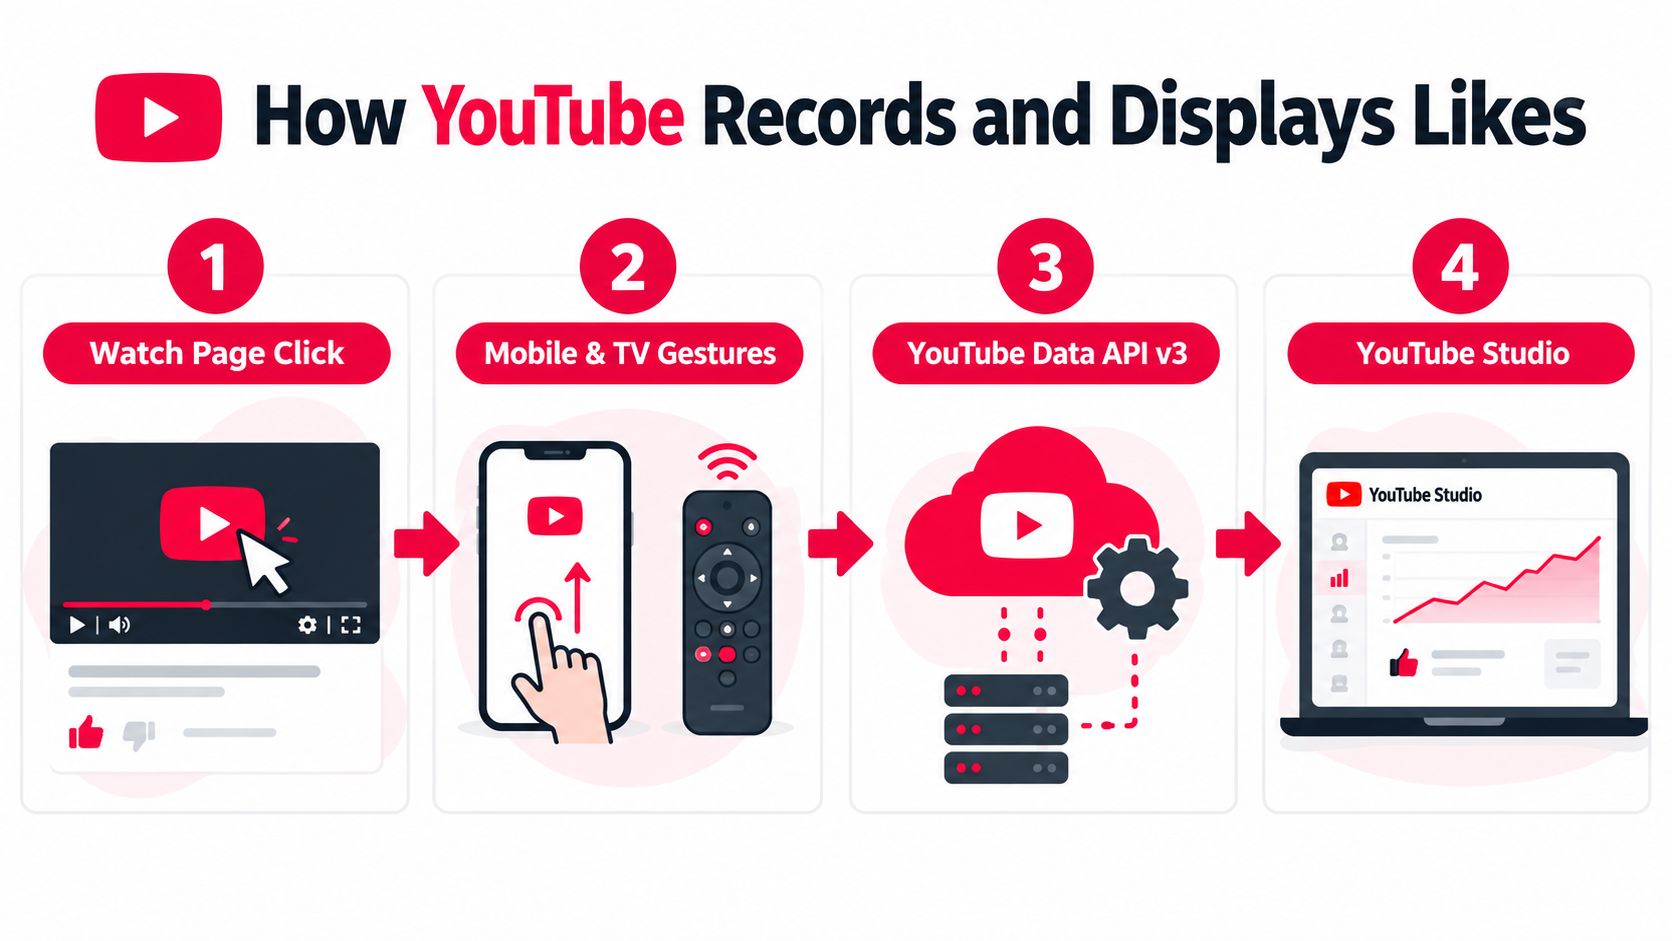
    An infographic illustrating the four-step process of how YouTube records and displays video like counts.

    Why totals can disagree

    Creators usually notice differences for practical reasons:

    • Processing delay: One surface may update before another.
    • Filtering: YouTube can remove activity that doesn't qualify.
    • Interface changes: Studio can relocate or hide a familiar column.
    • Tool timing: An API client or external dashboard may use cached data.
    • Public versus private analytics: The watch page and Studio don't expose identical fields.

    The platform's product surfaces have changed repeatedly. YouTube publicly tested removing the visible dislike count in 2021, while the like and dislike history remained available through account activity views rather than being fully deleted, as documented in coverage of the 2021 YouTube engagement-count change.

    By 2026, the like count was still a moving Studio interface element. Reporting noted that the Likes column began disappearing from the Content page around mid-to-late May 2026, with creator complaints peaking in late June 2026. That doesn't mean likes stopped being recorded. It means the place where creators saw the value continued to change, as described in reporting on the YouTube Studio Likes column.

    If you're comparing channel performance, also separate likes from views. A YouTube views calculation guide can help clarify why view reporting and engagement reporting shouldn't be treated as one identical counter. Creators evaluating channel income may also find a Forexyoutube monetization tool useful for putting monetization questions beside, rather than inside, the like metric.

    Why the Public Like Count Is Only One Signal

    The visible count answers a narrow question: how many eligible viewers selected thumbs up? It doesn't answer whether YouTube should recommend the video more widely, whether viewers found the opening compelling, or whether the content created value after the session ended.

    YouTube's own help guidance frames likes as one engagement signal among views, subscriptions, and other interactions, rather than a standalone growth engine. YouTube's creator documentation on analytics and engagement is useful because it places likes inside a broader measurement system.

    The deeper signals behind performance

    A strong like response can coexist with weak retention. A controversial title can attract viewers who react quickly, then leave before the main explanation. A practical tutorial can receive fewer visible likes while keeping viewers engaged, earning returning viewers, and generating useful clicks.

    Read the signals together:

    Metric Where It Appears Role in Recommendation System What Movement Tells Creators
    Public likes Watch page and selected Studio surfaces Supporting sentiment signal Viewers found a reason to approve or support the video
    Retention YouTube Studio Analytics Shows whether the video holds attention The script, pacing, and payoff are working or failing
    Watch time and viewing behavior YouTube Studio Analytics Helps describe session quality Viewers spend meaningful time with the content
    Click-through rate YouTube Studio Analytics Connects impressions with viewing decisions Packaging attracts or fails to attract the intended audience
    Shares, subscriptions, and return visits Studio and audience reports Shows deeper audience response The video may have created a relationship beyond a single reaction

    This is why a high like-to-view ratio can mislead. A small but enthusiastic audience may like nearly everything, while a broader audience may watch carefully without pressing the button. Neither pattern proves success by itself.

    A better interpretation framework has three questions. Did the viewer stay for the promised value? Did the viewer take a useful next action? Did the video attract the audience the channel wants to serve?

    A public like count is visible feedback. Retention and downstream behavior explain whether that feedback matters.

    Use the count as a diagnostic clue. If likes rise while retention falls, inspect the opening and packaging. If likes remain modest but returning viewers, subscriptions, or qualified clicks improve, don't dismiss the video. For a wider look at how multiple signals combine into breakout performance, explore what makes a YouTube video go viral.

    Practical Tactics Creators Use to Earn Meaningful Likes

    Meaningful likes usually follow a clear exchange. The viewer receives a useful idea, an emotional payoff, a solution, or a memorable experience, then chooses to signal approval. Asking for a like can help, but the request works best when the video has already earned the response.
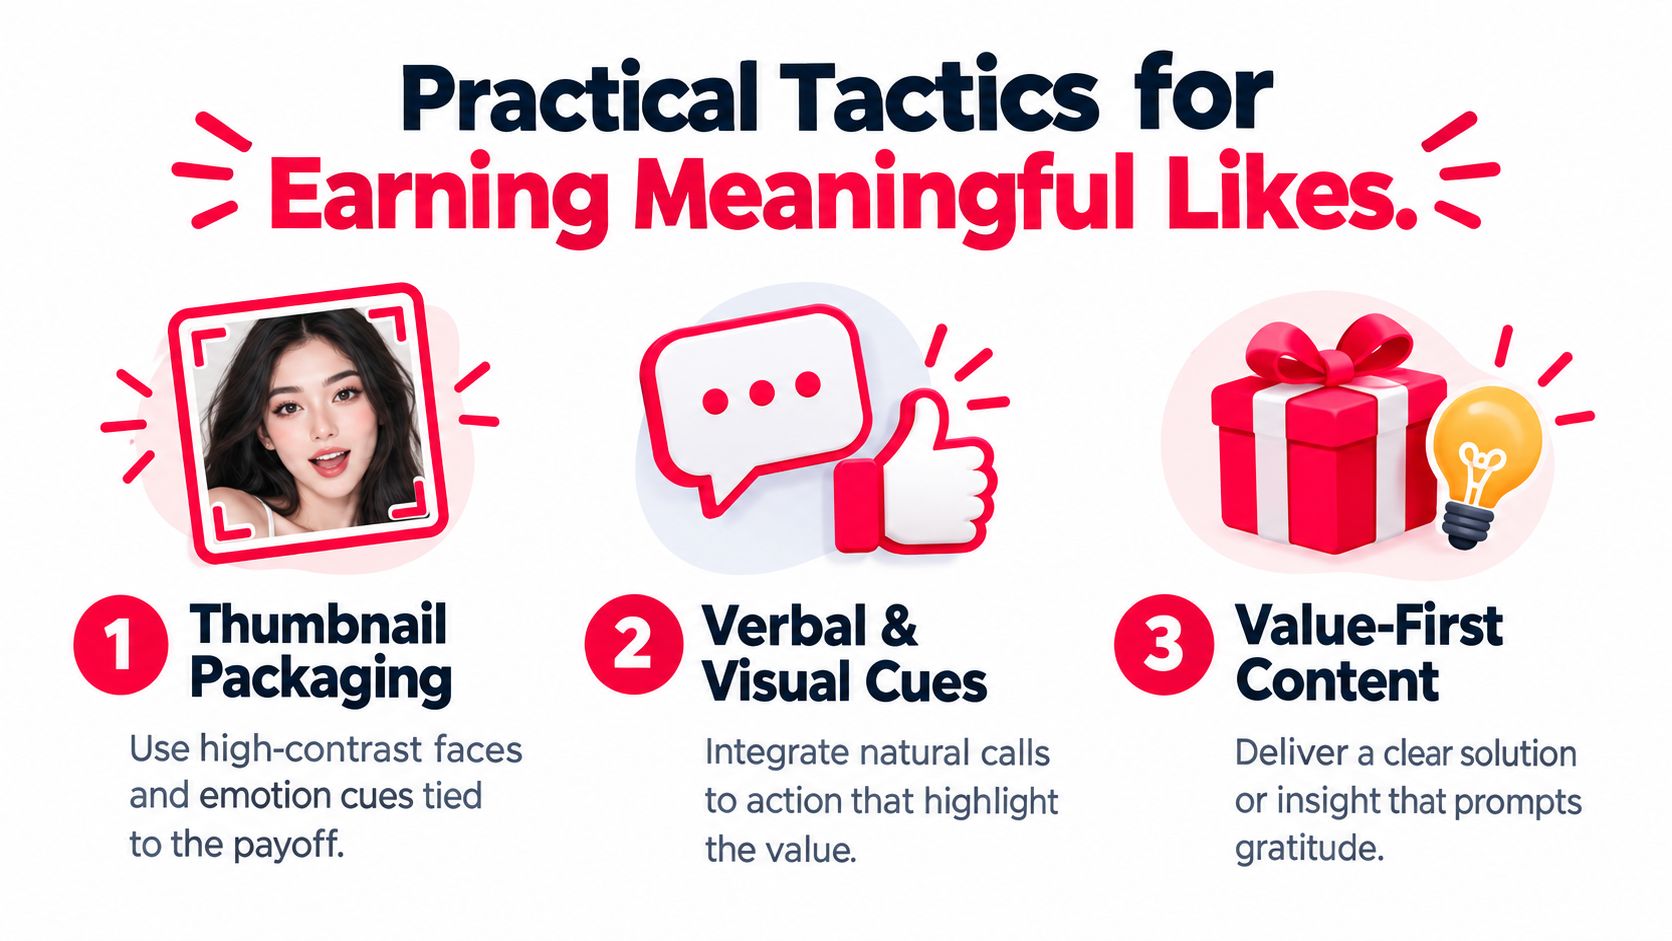
    An infographic titled Practical Tactics for Earning Meaningful Likes, illustrating three steps to improve engagement through effective content.

    Start with the promise viewers can recognize

    Your thumbnail should make the payoff legible. Use a face when human reaction matters, strong contrast when the subject needs to stand out, and an emotion cue that matches what the video delivers. A dramatic expression attached to a calm educational explanation can win the click but weaken trust once the viewer starts watching.

    The title and thumbnail should form one promise, not two competing ones. If the title promises a fix for a specific problem, the opening should confirm that problem quickly and establish why the viewer should continue.

    Build the like into the value exchange

    A natural prompt connects the action to the viewer's experience:

    • After a useful solution: “If this fixed the issue, tap like so I know this format helped.”
    • After a clear comparison: “If the distinction is useful, leave a like before we test the next option.”
    • Before a transition: “If you're getting value from this breakdown, a like helps other viewers find it.”

    These prompts work because they give the viewer a reason. Avoid repeating the request so often that it interrupts the lesson, story, or review.

    The strongest moment may come after the first confirmed payoff, not immediately after the greeting. Viewers haven't received enough value at the start to make the request feel earned.

    Use the surrounding channel experience

    A pinned comment can extend the conversation with a focused question. Ask viewers to identify the part they'll apply, choose between two options, or describe the problem that brought them to the video. That creates a reason to comment without turning the video into an engagement contest.

    Community posts can prepare an audience before a premiere or upload. Share the problem, an early question, or a small decision point, then make the full video the place where viewers receive the complete answer.

    Playlists, chapters, cards, and end screens can guide interested viewers toward the next relevant piece of content. They don't manufacture a like, but they can help viewers continue through a coherent topic sequence. That additional context gives the original video a better chance of being remembered and appreciated.

    Know when restraint is the better tactic

    A direct prompt isn't suitable for every subject. Sensitive news, personal disclosures, grief-related material, or artistic shorts can lose credibility when the creator inserts a cheerful request at the wrong moment.

    YouTube has publicly discouraged engagement-bait patterns, so don't offer artificial rewards, pressure viewers to click repeatedly, or frame the like as a test of loyalty. Make the request optional, specific, and subordinate to the content.

    The aim isn't to make every viewer press a button. It's to create a video where the button feels like a reasonable response to the value delivered.

    Reading Likes Against Revenue and Attribution

    A public like can show appreciation, but it can't settle a revenue question. Revenue depends on the audience reached, the viewing experience, monetization conditions, offers presented, and the actions people take after watching.

    Creators should read the like-to-view relationship beside average view duration, retention, click-through rate, subscriber conversion, RPM, and attribution events. These metrics answer different questions. Likes describe a reaction. Retention describes attention. Attribution connects content with a measurable business outcome.

    The signals that matter after the reaction

    A video can attract enthusiastic approval but send few people toward an offer. Another can generate quieter engagement while introducing qualified viewers to a service, course, product, or consultation.

    Signal What It Measures Revenue Connection
    Public likes Visible approval from eligible viewers Indicates sentiment, but doesn't identify buyers
    Average view duration How long viewers stay Helps show whether the content holds attention around the offer
    Retention Where viewers continue or leave Reveals whether the explanation reaches its important moments
    RPM and ad performance Monetization associated with viewing Connects audience activity with advertising revenue
    Clicks, leads, and sales Actions after exposure Shows whether content contributes to commercial results

    Don't use invented benchmarks to judge one video against another. Instead, compare videos within your own channel and ask whether the audience behavior matches the business goal.

    For example, a video designed to sell a service should have a clear path from explanation to action. Use trackable links in the description, pinned comment, or relevant post, then compare the resulting clicks and conversions with the visible reaction. A thumbs-up can't tell you which viewer became a lead, but attribution can connect the content to that journey.

    Creators who want a practical walkthrough can read YouTube Studio metrics before building a reporting routine. Studio provides the behavioral context needed to avoid making decisions from the loudest number on the page.

    Decision filter: Keep likes in the report, but let retention, qualified clicks, subscriptions, and attributed revenue decide what you publish next.

    A useful weighting approach is simple. First, confirm that the video reached the intended audience. Next, inspect whether viewers stayed for the core promise. Then review the actions that support the channel's objective. Finally, use likes to understand sentiment and identify topics viewers openly appreciated.

    Troubleshooting Sudden Drops and Discrepancies

    A falling like count feels personal because creators often watch it as a live audience verdict. It isn't always one. YouTube can reconcile activity after the initial display, and different reporting surfaces can show different stages of that reconciliation.

    Start by separating a count problem from an audience problem. If the like number changed but retention, comments, returning viewers, and traffic sources look stable, the count may reflect filtering, delayed processing, or an interface difference rather than a sudden change in audience opinion.

    A calm diagnostic sequence

    Use this order before changing the title, deleting the video, or publishing an apology:

    1. Check the same video in multiple surfaces. Compare the public watch page with Studio and any legitimate API-based reporting tool you already use.
    2. Look for platform notices. Review Studio messages and removal reports for signs that YouTube has invalidated activity.
    3. Inspect behavior, not just reactions. Check retention, traffic sources, and returning viewers for a matching movement.
    4. Allow processing time. A temporary discrepancy can resolve after YouTube finishes updating its systems.
    5. Record the change. Save the date, surface, and displayed value so you can identify a recurring reporting pattern.

    Don't assume the Data API and watch page must return an identical value at every moment. They can update on different schedules, and an external dashboard may add another delay.

    When the shift may reflect a real problem

    A genuine audience reaction often leaves more than one trace. If a controversial statement appears at a specific timestamp, retention may dip there and comments may become more critical. If a title or thumbnail changes, click-through rate may move while the content itself remains unchanged.

    A recommendation loop can also bring a video to viewers who aren't a good fit. In that case, the count may grow while retention weakens, or negative feedback may become more visible in comments and audience reports.

    Avoid reacting to one number in isolation. Compare the timing of the like movement with publishing changes, packaging edits, traffic-source changes, and audience behavior. If the public count is the only metric that moved, investigate reporting first. If several signals changed together, review the content and distribution strategy.

    Creator Checklist and What Comes Next

    Run this checklist before publishing and during the first monitoring window:

    1. Audit the thumbnail: Confirm that the visual cue matches the actual payoff.
    2. Script the value hook: State the problem and intended result early.
    3. Time the CTA naturally: Ask for a like after a useful moment, not before the viewer has context.
    4. Engage early viewers: Reply to comments and look for repeated questions.
    5. Respond with substance: Use comments to identify confusion, appreciation, and objections.
    6. Cross-promote selectively: Send the video to audiences that need its subject.
    7. Monitor live signals: Compare likes with retention, traffic sources, and viewing behavior.
    8. Test packaging carefully: Change titles or thumbnails only when you have a clear reason.
    9. Review end screens: Guide satisfied viewers toward the next relevant video.
    10. Analyze the early data: Compare the initial response with later audience quality instead of chasing a single count.
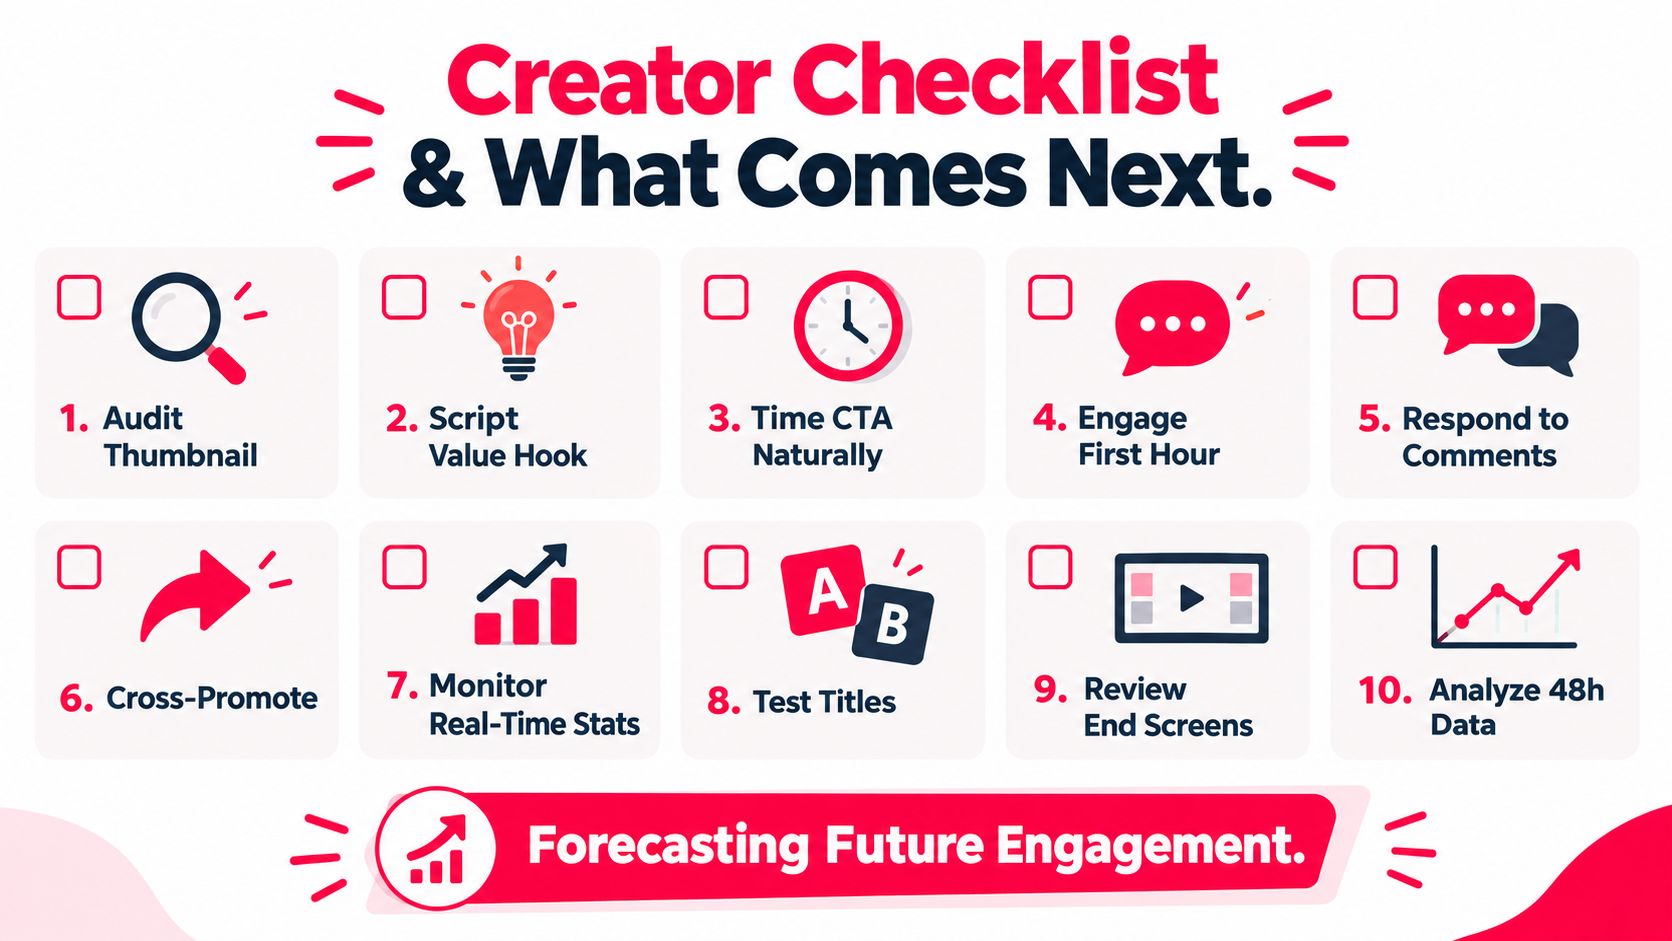
    A creator checklist infographic featuring ten numbered steps for optimizing YouTube video performance and future engagement.

    What may change next

    The public presentation of engagement is likely to remain flexible through 2026. YouTube has already changed how dislike information appears publicly, and Studio has continued reorganizing where creators find like data. Future interface changes could alter visibility or presentation again, but that possibility shouldn't change the core measurement habit.

    YouTube has also updated public view-count language to emphasize engaged views in Analytics, reinforcing the difference between visible surface counts and the metrics creators use internally. The practical implication is clear. Build reporting around behavior and outcomes, then use the public like count as supporting context.

    Don't buy likes. Artificial activity may inflate the visible number while weakening the reliability of your reports and giving you no trustworthy evidence about audience satisfaction or commercial intent.

    A public like count is most valuable when it reflects audience respect, not when it becomes the goal itself.


    ViewsMax helps creators connect content with measurable business actions by creating trackable links and showing clicks, leads, and attributed sales alongside content performance. If you want to move beyond counting likes and identify which videos contribute to revenue, visit ViewsMax and build your attribution workflow around the audience actions that matter.
  • How to See Who Watched Your YouTube Video

    How to See Who Watched Your YouTube Video

    The most popular advice on how to see who watched your YouTube video is usually wrong. You can't install a legitimate browser extension, connect a dashboard, or pay for a third-party service that reveals the names of individual viewers. YouTube doesn't provide that information to creators, and any service claiming otherwise isn't reflecting YouTube's native analytics model.

    What you can build is more useful for channel growth and revenue: an audience intelligence system based on aggregate demographics, viewing behavior, engagement signals, and attributed sales. That shift changes the question from “Who was that viewer?” to “Which audience segment watched, what did they do, and did the video help produce a business result?”

    The Truth About Identifying YouTube Viewers

    YouTube keeps viewer identity separate from creator analytics. A creator can see audience patterns inside YouTube Studio, but not the specific names, accounts, email addresses, or usernames of people who watched a video. The Audience tab reports anonymized information such as age ranges, gender distribution, geographies, and returning versus new viewers, as described in YouTube's official Audience reports.

    That privacy boundary applies whether a viewer watches for a few seconds, finishes the video, returns later, or watches without subscribing. The platform gives you an aggregated view of the audience rather than a person-by-person attendance list. A creator asking how to see who watched their YouTube video therefore needs to distinguish between identity data and behavioral data.

    Identity data answers, “Which account watched?” YouTube doesn't expose that answer. Behavioral data answers, “Which audiences returned, where did viewers drop off, which locations generated watch time, and which traffic sources brought people in?” That's the information available for analysis, and it's what you can use to improve titles, thumbnails, topics, openings, and calls to action.

    Why the limitation is deliberate

    YouTube's demographic reporting has followed an aggregate-only model for years. In November 2011, Google announced a demographics tab in YouTube Insight that broke views down by age group and gender using account data without revealing personally identifying information. The current Audience tab continues that privacy-first direction rather than turning creator analytics into a viewer directory.

    This matters for more than compliance. A named viewer list would create poor incentives for creators, invite invasive targeting, and still wouldn't explain whether the person found the video useful. A segment showing that returning viewers from a particular geography consistently watch a topic to the end can guide programming decisions without exposing anyone's identity.

    Practical rule: Treat YouTube Analytics as a behavioral research tool, not a visitor log.

    Creators sometimes lose time testing services that promise “secret viewer tracking.” Those tools can't override what YouTube makes available through its own reporting. A more productive approach is to study the signals that indicate audience fit, then add your own consent-based tracking outside YouTube when a viewer chooses to click, submit a form, or contact your business.

    For creators focused on growth, resources such as YouTube view growth for small businesses are more useful when they frame views as an acquisition problem rather than a hunt for private identities. The core lesson is simple: you won't identify individual watchers, but you can learn which audiences your content attracts and what they do next.

    Navigating YouTube Studio Audience Analytics

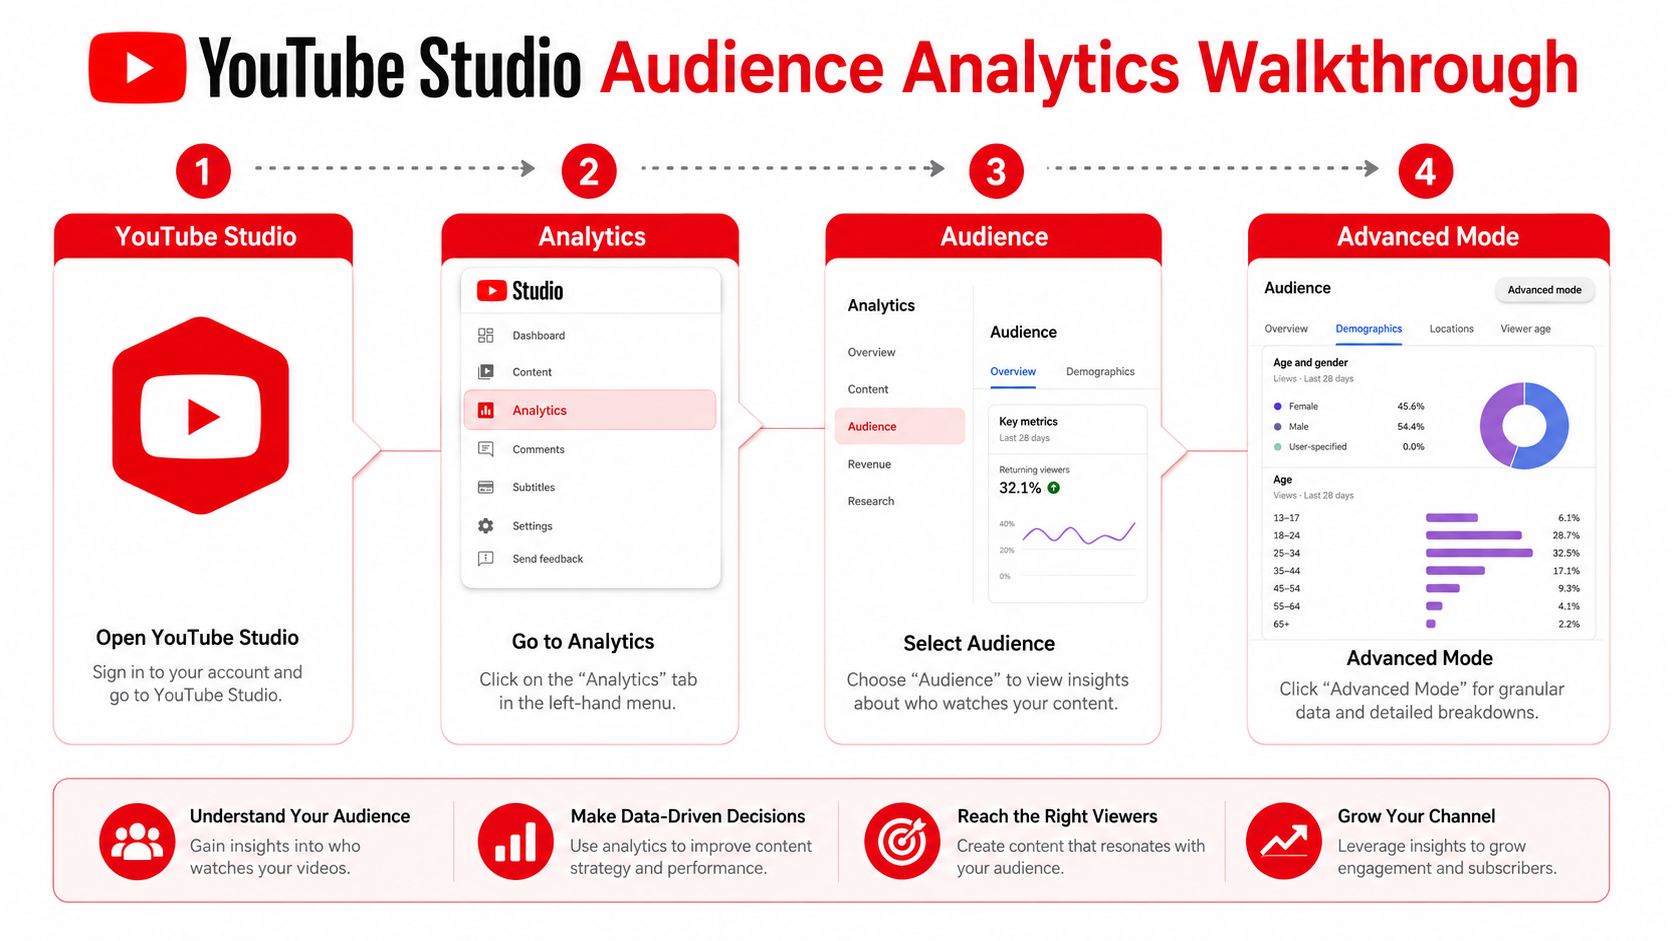
    YouTube Studio gives you the strongest native answer to the question of who watched your video, provided you define “who” as an audience segment. Start by opening YouTube Studio, selecting Analytics, and choosing the video or channel view you want to inspect. The Audience tab contains the demographic and returning-viewer reports, while Advanced mode helps you compare metrics and dimensions across content.

    A four-step infographic explaining how to navigate YouTube Studio to access detailed audience demographic analytics and insights.

    Use the reports in a deliberate order. First, establish the audience profile. Then examine whether that audience is new or returning. Finally, compare the profile with watch time, traffic sources, and individual video performance so you're not treating a demographic slice as a complete explanation.

    A practical Studio workflow

    1. Select the reporting scope. Choose a specific video when you're diagnosing one upload, or use channel analytics when you're looking for a broader programming pattern. A single video can attract an unusual audience, so channel-level context helps prevent overreaction.

    2. Open the Audience tab. Review age ranges, gender distribution, geographies, and the split between returning and new viewers. YouTube's Audience report also indicates which age ranges contribute the most watch time, which is more useful than seeing who generated impressions.

    3. Interpret segments, not individuals. A geography report can show where viewership is concentrated, but it won't identify a person in that location. Likewise, an age range describes an audience group, not a verified profile for every watcher.

    4. Move into Advanced mode. Compare videos, traffic sources, watch time, unique viewers, and returning-viewer behavior. You can test whether a topic consistently attracts the same type of audience rather than relying on one headline number.

    The unique viewers metric is the closest native approximation to audience size, but it still isn't a list of accounts. YouTube limits unique-viewer reporting windows to up to 90 days for data quality, so compare trends across 7-day, 28-day, and 90-day slices rather than expecting lifetime, per-viewer attribution. These windows help separate an initial launch response from a broader pattern of people returning to your channel.

    Avoid this mistake: A small audience segment can look decisive simply because the sample is limited. Use it as a directional clue, then verify it against retention, traffic sources, and behavior across multiple videos.

    You can also compare new and returning viewers. A video with strong new-viewer reach may be effective at discovery, while a video watched heavily by returning viewers may be serving your existing audience well. Neither result is automatically superior. The right interpretation depends on whether the video's job is to attract unfamiliar viewers, deepen trust, support a product, or move an existing subscriber toward an offer.

    For a broader explanation of these reports and how they fit into channel analysis, see this guide to YouTube view stats. Native Studio data tells you what audience groups are present. It doesn't tell you which viewer personally watched, nor does it automatically prove that a view produced revenue.

    Use this embedded walkthrough as a visual reference while checking the reports in your own Studio account.

    Reading Audience Retention as Viewer Behavior

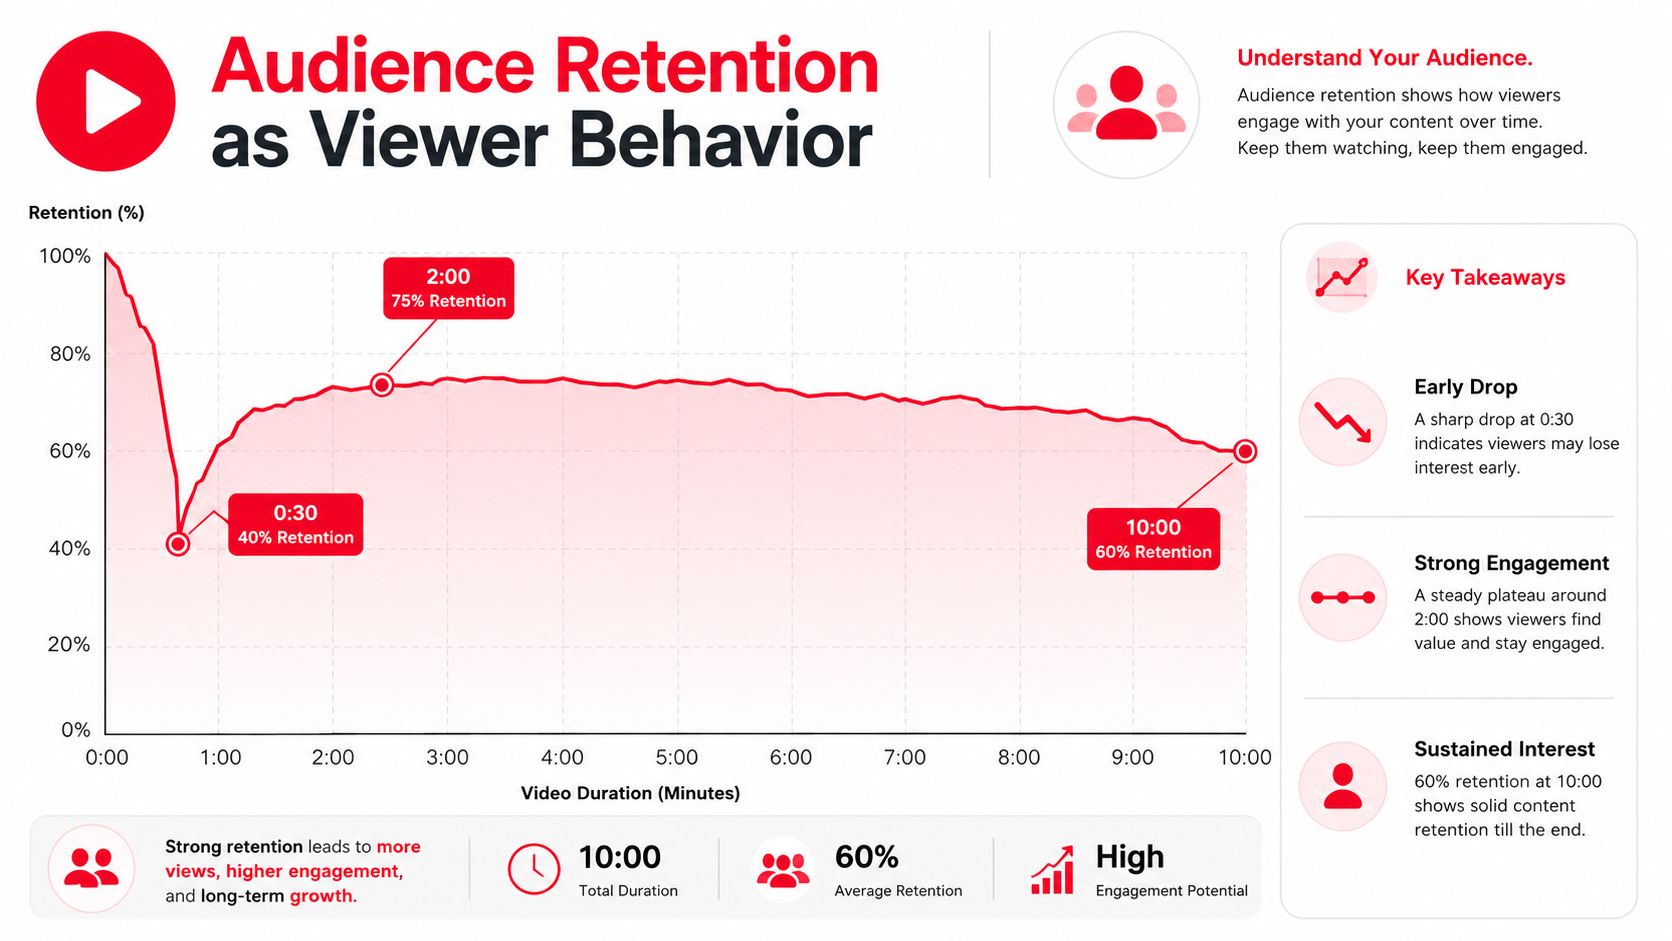
    Demographics tell you what audience segments YouTube can report. Audience retention tells you what viewers did during playback. It shows where people stayed, where they left, and where they replayed, making it one of the closest available proxies for understanding viewer intent without identifying anyone personally.

    Open the Engagement tab for the relevant video and inspect the retention graph alongside average view duration and average percentage viewed. Don't read any one curve in isolation. A high average percentage viewed can reflect a short video with strong completion, while a longer video may generate meaningful watch time despite a lower percentage watched.

    A graph illustrating audience retention rates over a ten-minute YouTube video duration, highlighting engagement trends.

    What the graph reveals

    A sharp decline near the opening often points to a mismatch between the thumbnail promise and the first moments of the video. It can also indicate a slow introduction, unnecessary branding, or a title that attracts curiosity without matching the actual subject. A drop at a chapter transition may reveal that viewers wanted one specific answer and didn't need the remaining material.

    Rewatch spikes require more careful judgment. A spike can indicate that viewers found a section valuable enough to revisit, but it can also show confusion, unclear wording, a dense visual, or instructions that viewers had to replay. Cross-check the spike with comments, chapter structure, and subsequent click-through behavior before labeling it a positive engagement signal.

    Absolute and relative retention

    Absolute retention shows the raw percentage watched across the video. It helps you see the actual shape of viewer attention within that upload. Relative retention compares your video with other videos of similar length, which makes it more useful when judging whether a long-form upload holds attention better or worse than comparable content.

    The comparison only works when the videos are reasonably similar in format and length. Comparing a compact tutorial with a long interview can produce misleading conclusions because viewers behave differently across those formats. YouTube-focused creator guidance on audience-retention strategies also emphasizes using both absolute and relative views of retention to reduce false conclusions.

    Build behavioral audience profiles from the combined evidence:

    • Fast drop-offs: Viewers may be arriving through broad discovery but failing to find immediate relevance.
    • Stable mid-video viewing: The topic and structure may be matching viewer intent after the opening.
    • Rewatch clusters: A section may be highly useful, visually dense, or difficult to understand.
    • End-screen survival: Viewers who remain near the conclusion are more likely to encounter your next-video or offer prompt.

    Read retention as a sequence of decisions. Every cliff, plateau, and spike shows how viewers responded to a particular promise, explanation, transition, or request.

    The most valuable comparison is often between videos aimed at the same business goal. If one tutorial produces lower raw reach but stronger retention and more meaningful follow-on actions, it may be a better commercial asset than a widely viewed entertainment upload. That's why watch time and retention should be connected to traffic sources and external actions rather than treated as vanity metrics.

    Tools and workflows designed to support channel watch time can help with the measurement process, but they can't reveal individual identities. A YouTube watch-time resource is useful when it keeps the focus on attracting and retaining the right audience, not on trying to reverse YouTube's privacy model.

    Workarounds to Capture Viewer Intent Signals

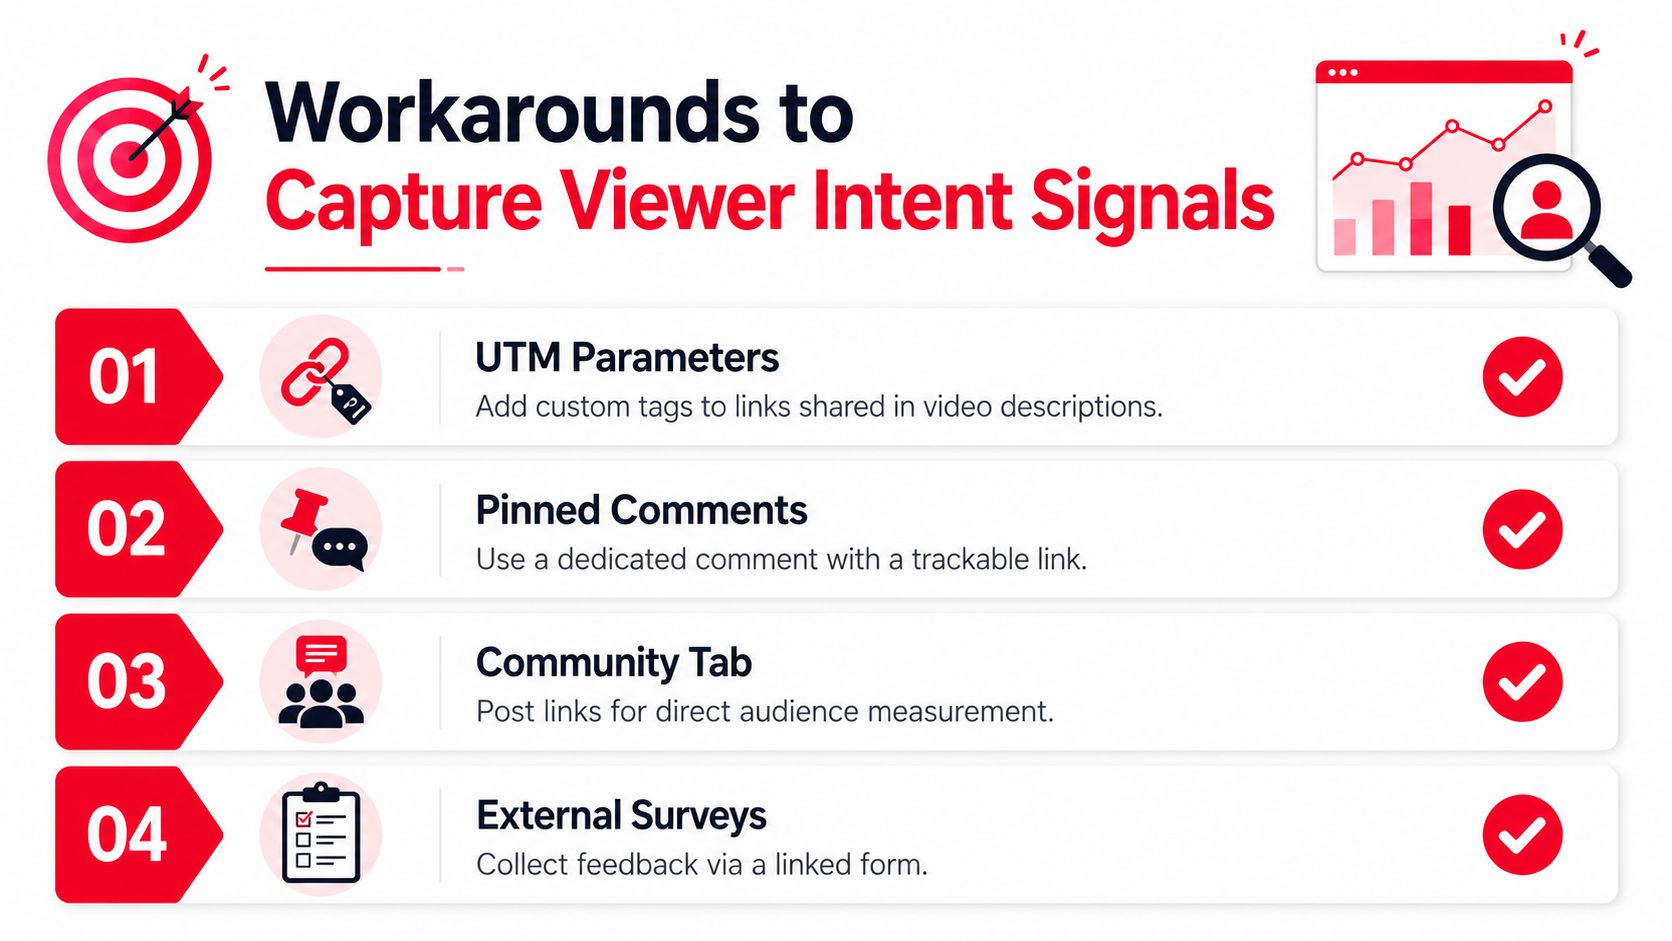
    YouTube won't show you the individual people behind a view, but you can capture information when viewers voluntarily take an identifiable action outside the viewing session. The key is to create a clear exchange: give the audience a useful next step, then measure the response with transparent tracking.

    Start with a separate destination for each video or campaign. Add UTM parameters to the link in the description, use a dedicated pinned comment, and keep the call to action specific enough that you know what interest the click represents. A generic homepage link produces weak evidence. A video-specific guide, consultation form, product page, or lesson signup creates a clearer intent signal.

    An infographic titled Workarounds to Capture Viewer Intent Signals featuring four tips for tracking YouTube audience engagement.

    Turn voluntary actions into useful segments

    Track links by video. Create a distinct link for each upload, not just one link for the whole channel. This lets your analytics distinguish interest generated by a comparison video from interest generated by a beginner tutorial.

    Use gated content selectively. A downloadable checklist, worksheet, or extended resource can invite viewers to submit contact information. The form should explain what the person is requesting and how you'll use the information. Gating every resource creates friction, so reserve it for content with enough value to justify the exchange.

    Pin one focused comment. A pinned comment can act as an intent filter when it asks viewers to take one relevant action. Use a trackable destination and avoid sending people to several unrelated offers at once.

    Segment through community interactions. Community posts, polls, replies, and linked resources can reveal which subjects generate active interest. These actions still don't identify everyone who watched, but they can show which viewers choose to self-select around a topic.

    End screens provide another behavioral signal. A viewer who clicks from a tutorial into an advanced video has expressed a different interest from someone who watches only the original upload. Organize related videos into clear paths, such as beginner education, product comparison, implementation, and consultation.

    YouTube's analytics model is also placing more emphasis on the quality of viewing behavior. Recent YouTube help coverage discusses an “engaged views” metric in analytics, reinforcing the need to interpret viewing data as behavior rather than identity. The practical consequence is that raw view counts should sit beside watch patterns, clicks, comments, and downstream actions.

    Don't promise that every viewer will identify themselves. Most won't click, complete a form, or comment, and external analytics can measure only the people who take those actions. The value comes from combining partial signals consistently, then looking for repeated relationships between a topic, a viewer action, and a business outcome.

    Connecting Video Views to Revenue with ViewsMax

    A YouTube view is not a sale, and even strong retention doesn't prove that a video influenced revenue. The missing layer is attribution, a system that connects a specific piece of content to the clicks, leads, calls, or purchases that follow.

    ViewsMax provides that layer by letting creators create trackable links for offers, place those links in video descriptions, bios, and posts, and connect resulting activity back to the content that generated it. Instead of asking whether a video “performed,” you can inspect which content produced measurable commercial actions.

    Screenshot from https://blog.viewsmax.com

    A revenue-focused publishing loop

    Plan the offer before publishing the video. If the upload is a product tutorial, connect it to that product. If it answers a service question, connect it to a relevant consultation or lead form. Then use a distinct tracked link in the description and, where appropriate, the pinned comment or end-screen destination.

    After publishing, review the content and outcome together:

    • YouTube metrics: Views, watch time, retention, traffic sources, and returning-viewer behavior.
    • Intent actions: Link clicks, form submissions, calls booked, or other measured conversions.
    • Business outcome: Revenue attributed to the relevant content and offer.

    That comparison often changes editorial priorities. A high-reach video may introduce many people to the channel but produce little commercial activity. A narrower educational upload may attract fewer viewers while generating stronger buyer intent. Without attribution, the second video can look like a disappointment. With attribution, it may become the model for future content.

    ViewsMax also supports the surrounding workflow, including content planning, publishing across channels, and daily monitoring of clicks, calls booked, and attributed revenue. It isn't a tool for identifying individual YouTube viewers. It's a way to measure the voluntary actions that happen after viewers leave YouTube or follow an offer path.

    Revenue attribution doesn't replace YouTube Analytics. It completes it.

    Creators still need retention and audience reports to understand why a video attracts attention. They need external tracking to understand whether that attention turns into a business result. For broader on-page and discoverability considerations, the Chase McGowan video SEO guide offers useful context around improving the conditions that help videos get found.

    The important trade-off is measurement scope. YouTube can show broad audience behavior at scale, while an attribution system sees only trackable actions. Neither view is complete alone. Together, they show whether your content is building reach, earning attention, and contributing to sales. For creators evaluating the economics behind exposure, this guide to pay per 1000 views on YouTube can help separate view-based expectations from the broader commercial picture.

    Building Your Audience Intelligence Workflow

    A reliable workflow starts by assigning each tool a job. YouTube Studio explains audience composition and viewing behavior. External tracking captures voluntary intent. Revenue attribution connects those actions to business results. Trying to force one platform to answer all three questions creates bad analysis.

    Begin with a clean baseline. In YouTube Studio, record the Audience reports, returning versus new viewer patterns, traffic sources, and retention behavior for your important videos. Use the available 7-day, 28-day, and 90-day reporting slices for trend comparisons, remembering that unique-viewer reporting is limited to windows of up to 90 days for data quality, as documented in YouTube's unique viewers guidance.

    Then add one external action per commercial objective. A service channel might use a consultation link. A course creator might use a lesson or enrollment page. A product channel might use a specific offer page. Give every meaningful video its own tracking identity, and keep the call to action aligned with the promise made in the video.

    A practical operating rhythm

    At publishing: Check that the description link works, the destination matches the video, and the pinned comment gives viewers one clear next action.

    During review: Compare retention with clicks. If viewers watch closely but don't click, the offer or call to action may be poorly matched. If clicks are strong but leads or purchases are weak, inspect the landing-page experience and offer fit rather than changing the thumbnail immediately.

    During planning: Prioritize videos that combine audience fit, sustained viewing, and downstream action. A large view count with no measurable commercial response may still support awareness, but it shouldn't automatically receive more production effort than content that consistently creates qualified demand.

    Conflicting signals are normal. High views with low revenue can mean the topic has broad appeal but weak buying intent. Lower reach with strong attributed sales can indicate a valuable niche, a better offer match, or clearer viewer qualification. Use the conflict as a decision prompt, not as a reason to discard either metric.

    Keep the system lightweight enough to maintain. Start with native Audience and retention reports, then add tracked links to your priority offers. After the process becomes routine, compare content themes, traffic sources, viewer behavior, and attributed outcomes at the same time. That combination gives you a defensible answer to the original question: not the names of the people who watched, but which audiences engaged, what they wanted, and which videos helped create revenue.


    ViewsMax helps creators connect YouTube content to measurable actions through trackable links, content planning, publishing, and revenue attribution. Visit ViewsMax to see which videos are driving clicks, leads, calls, and sales instead of judging performance by views alone.