ViewsMax
Sign In Sign Up Free

Tag: video engagement

  • How to See Who Watched Your YouTube Video

    How to See Who Watched Your YouTube Video

    The most popular advice on how to see who watched your YouTube video is usually wrong. You can't install a legitimate browser extension, connect a dashboard, or pay for a third-party service that reveals the names of individual viewers. YouTube doesn't provide that information to creators, and any service claiming otherwise isn't reflecting YouTube's native analytics model.

    What you can build is more useful for channel growth and revenue: an audience intelligence system based on aggregate demographics, viewing behavior, engagement signals, and attributed sales. That shift changes the question from “Who was that viewer?” to “Which audience segment watched, what did they do, and did the video help produce a business result?”

    The Truth About Identifying YouTube Viewers

    YouTube keeps viewer identity separate from creator analytics. A creator can see audience patterns inside YouTube Studio, but not the specific names, accounts, email addresses, or usernames of people who watched a video. The Audience tab reports anonymized information such as age ranges, gender distribution, geographies, and returning versus new viewers, as described in YouTube's official Audience reports.

    That privacy boundary applies whether a viewer watches for a few seconds, finishes the video, returns later, or watches without subscribing. The platform gives you an aggregated view of the audience rather than a person-by-person attendance list. A creator asking how to see who watched their YouTube video therefore needs to distinguish between identity data and behavioral data.

    Identity data answers, “Which account watched?” YouTube doesn't expose that answer. Behavioral data answers, “Which audiences returned, where did viewers drop off, which locations generated watch time, and which traffic sources brought people in?” That's the information available for analysis, and it's what you can use to improve titles, thumbnails, topics, openings, and calls to action.

    Why the limitation is deliberate

    YouTube's demographic reporting has followed an aggregate-only model for years. In November 2011, Google announced a demographics tab in YouTube Insight that broke views down by age group and gender using account data without revealing personally identifying information. The current Audience tab continues that privacy-first direction rather than turning creator analytics into a viewer directory.

    This matters for more than compliance. A named viewer list would create poor incentives for creators, invite invasive targeting, and still wouldn't explain whether the person found the video useful. A segment showing that returning viewers from a particular geography consistently watch a topic to the end can guide programming decisions without exposing anyone's identity.

    Practical rule: Treat YouTube Analytics as a behavioral research tool, not a visitor log.

    Creators sometimes lose time testing services that promise “secret viewer tracking.” Those tools can't override what YouTube makes available through its own reporting. A more productive approach is to study the signals that indicate audience fit, then add your own consent-based tracking outside YouTube when a viewer chooses to click, submit a form, or contact your business.

    For creators focused on growth, resources such as YouTube view growth for small businesses are more useful when they frame views as an acquisition problem rather than a hunt for private identities. The core lesson is simple: you won't identify individual watchers, but you can learn which audiences your content attracts and what they do next.

    Navigating YouTube Studio Audience Analytics

    YouTube Studio gives you the strongest native answer to the question of who watched your video, provided you define “who” as an audience segment. Start by opening YouTube Studio, selecting Analytics, and choosing the video or channel view you want to inspect. The Audience tab contains the demographic and returning-viewer reports, while Advanced mode helps you compare metrics and dimensions across content.
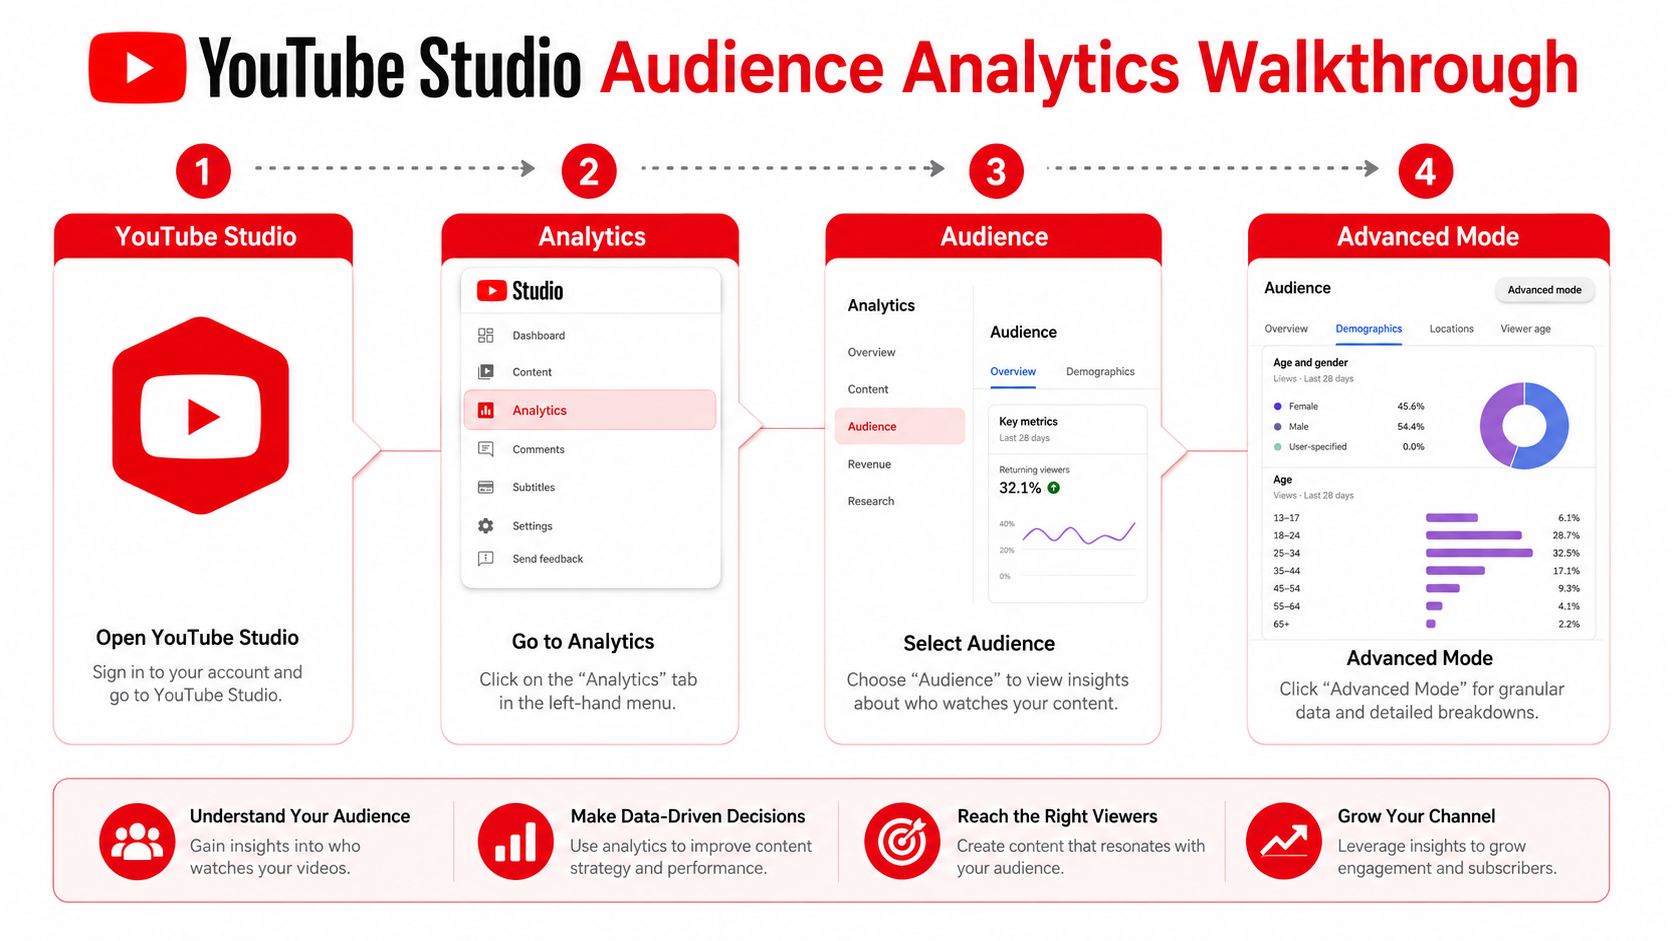
    A four-step infographic explaining how to navigate YouTube Studio to access detailed audience demographic analytics and insights.

    Use the reports in a deliberate order. First, establish the audience profile. Then examine whether that audience is new or returning. Finally, compare the profile with watch time, traffic sources, and individual video performance so you're not treating a demographic slice as a complete explanation.

    A practical Studio workflow

    1. Select the reporting scope. Choose a specific video when you're diagnosing one upload, or use channel analytics when you're looking for a broader programming pattern. A single video can attract an unusual audience, so channel-level context helps prevent overreaction.

    2. Open the Audience tab. Review age ranges, gender distribution, geographies, and the split between returning and new viewers. YouTube's Audience report also indicates which age ranges contribute the most watch time, which is more useful than seeing who generated impressions.

    3. Interpret segments, not individuals. A geography report can show where viewership is concentrated, but it won't identify a person in that location. Likewise, an age range describes an audience group, not a verified profile for every watcher.

    4. Move into Advanced mode. Compare videos, traffic sources, watch time, unique viewers, and returning-viewer behavior. You can test whether a topic consistently attracts the same type of audience rather than relying on one headline number.

    The unique viewers metric is the closest native approximation to audience size, but it still isn't a list of accounts. YouTube limits unique-viewer reporting windows to up to 90 days for data quality, so compare trends across 7-day, 28-day, and 90-day slices rather than expecting lifetime, per-viewer attribution. These windows help separate an initial launch response from a broader pattern of people returning to your channel.

    Avoid this mistake: A small audience segment can look decisive simply because the sample is limited. Use it as a directional clue, then verify it against retention, traffic sources, and behavior across multiple videos.

    You can also compare new and returning viewers. A video with strong new-viewer reach may be effective at discovery, while a video watched heavily by returning viewers may be serving your existing audience well. Neither result is automatically superior. The right interpretation depends on whether the video's job is to attract unfamiliar viewers, deepen trust, support a product, or move an existing subscriber toward an offer.

    For a broader explanation of these reports and how they fit into channel analysis, see this guide to YouTube view stats. Native Studio data tells you what audience groups are present. It doesn't tell you which viewer personally watched, nor does it automatically prove that a view produced revenue.

    Use this embedded walkthrough as a visual reference while checking the reports in your own Studio account.

    Reading Audience Retention as Viewer Behavior

    Demographics tell you what audience segments YouTube can report. Audience retention tells you what viewers did during playback. It shows where people stayed, where they left, and where they replayed, making it one of the closest available proxies for understanding viewer intent without identifying anyone personally.

    Open the Engagement tab for the relevant video and inspect the retention graph alongside average view duration and average percentage viewed. Don't read any one curve in isolation. A high average percentage viewed can reflect a short video with strong completion, while a longer video may generate meaningful watch time despite a lower percentage watched.
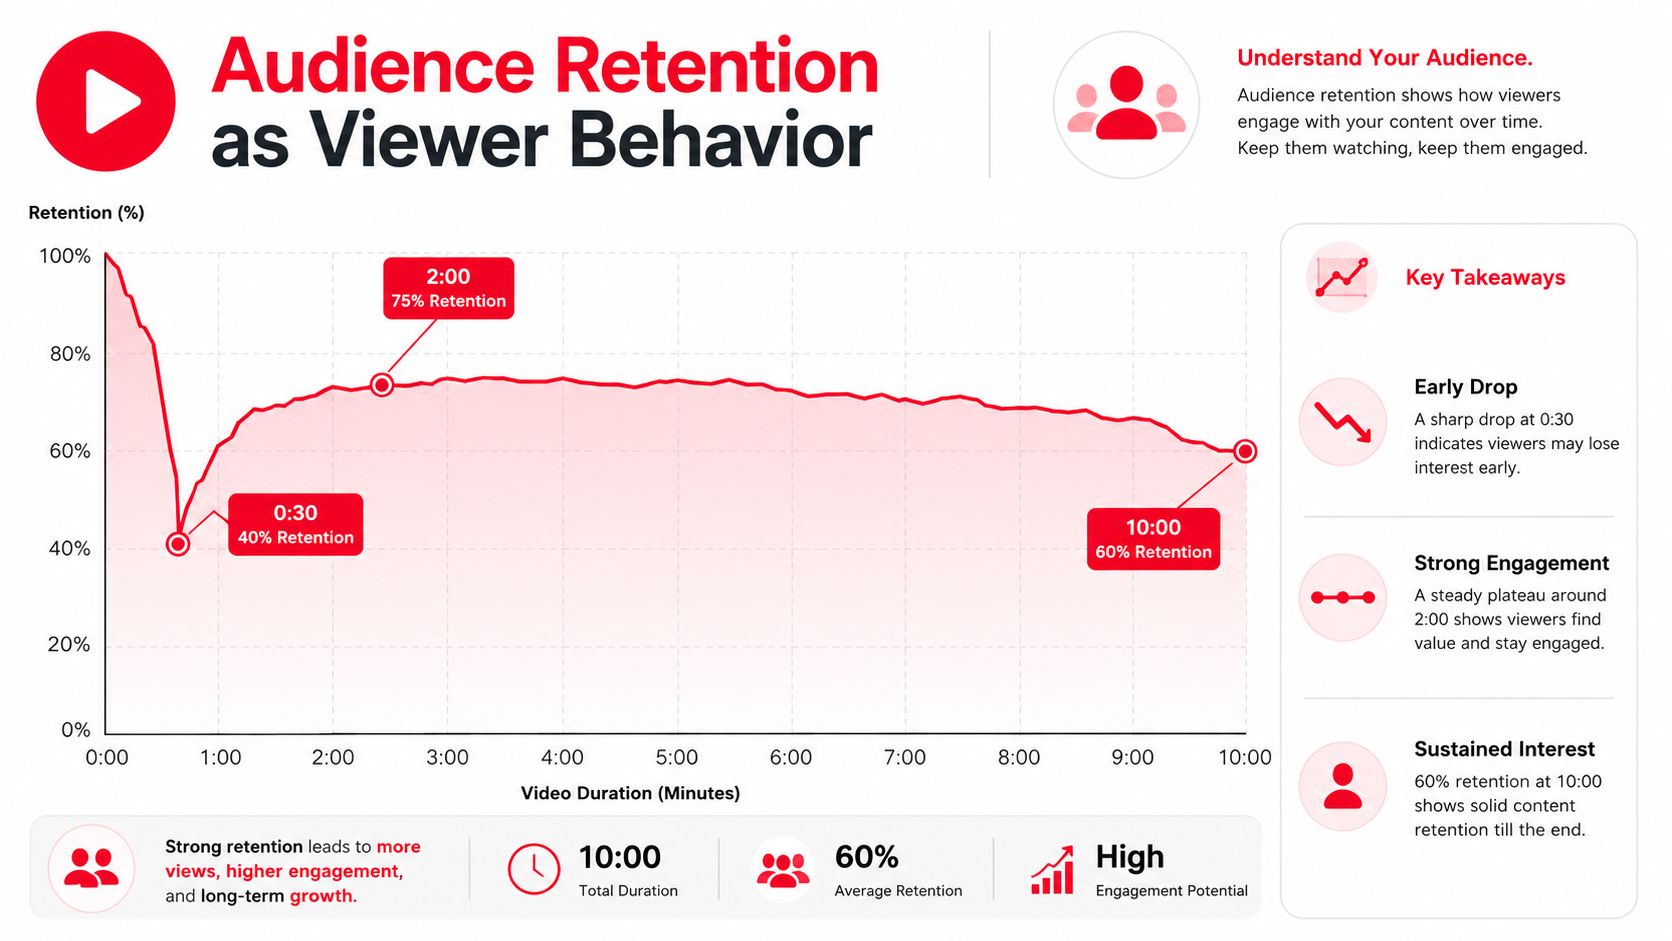
    A graph illustrating audience retention rates over a ten-minute YouTube video duration, highlighting engagement trends.

    What the graph reveals

    A sharp decline near the opening often points to a mismatch between the thumbnail promise and the first moments of the video. It can also indicate a slow introduction, unnecessary branding, or a title that attracts curiosity without matching the actual subject. A drop at a chapter transition may reveal that viewers wanted one specific answer and didn't need the remaining material.

    Rewatch spikes require more careful judgment. A spike can indicate that viewers found a section valuable enough to revisit, but it can also show confusion, unclear wording, a dense visual, or instructions that viewers had to replay. Cross-check the spike with comments, chapter structure, and subsequent click-through behavior before labeling it a positive engagement signal.

    Absolute and relative retention

    Absolute retention shows the raw percentage watched across the video. It helps you see the actual shape of viewer attention within that upload. Relative retention compares your video with other videos of similar length, which makes it more useful when judging whether a long-form upload holds attention better or worse than comparable content.

    The comparison only works when the videos are reasonably similar in format and length. Comparing a compact tutorial with a long interview can produce misleading conclusions because viewers behave differently across those formats. YouTube-focused creator guidance on audience-retention strategies also emphasizes using both absolute and relative views of retention to reduce false conclusions.

    Build behavioral audience profiles from the combined evidence:

    • Fast drop-offs: Viewers may be arriving through broad discovery but failing to find immediate relevance.
    • Stable mid-video viewing: The topic and structure may be matching viewer intent after the opening.
    • Rewatch clusters: A section may be highly useful, visually dense, or difficult to understand.
    • End-screen survival: Viewers who remain near the conclusion are more likely to encounter your next-video or offer prompt.

    Read retention as a sequence of decisions. Every cliff, plateau, and spike shows how viewers responded to a particular promise, explanation, transition, or request.

    The most valuable comparison is often between videos aimed at the same business goal. If one tutorial produces lower raw reach but stronger retention and more meaningful follow-on actions, it may be a better commercial asset than a widely viewed entertainment upload. That's why watch time and retention should be connected to traffic sources and external actions rather than treated as vanity metrics.

    Tools and workflows designed to support channel watch time can help with the measurement process, but they can't reveal individual identities. A YouTube watch-time resource is useful when it keeps the focus on attracting and retaining the right audience, not on trying to reverse YouTube's privacy model.

    Workarounds to Capture Viewer Intent Signals

    YouTube won't show you the individual people behind a view, but you can capture information when viewers voluntarily take an identifiable action outside the viewing session. The key is to create a clear exchange: give the audience a useful next step, then measure the response with transparent tracking.

    Start with a separate destination for each video or campaign. Add UTM parameters to the link in the description, use a dedicated pinned comment, and keep the call to action specific enough that you know what interest the click represents. A generic homepage link produces weak evidence. A video-specific guide, consultation form, product page, or lesson signup creates a clearer intent signal.
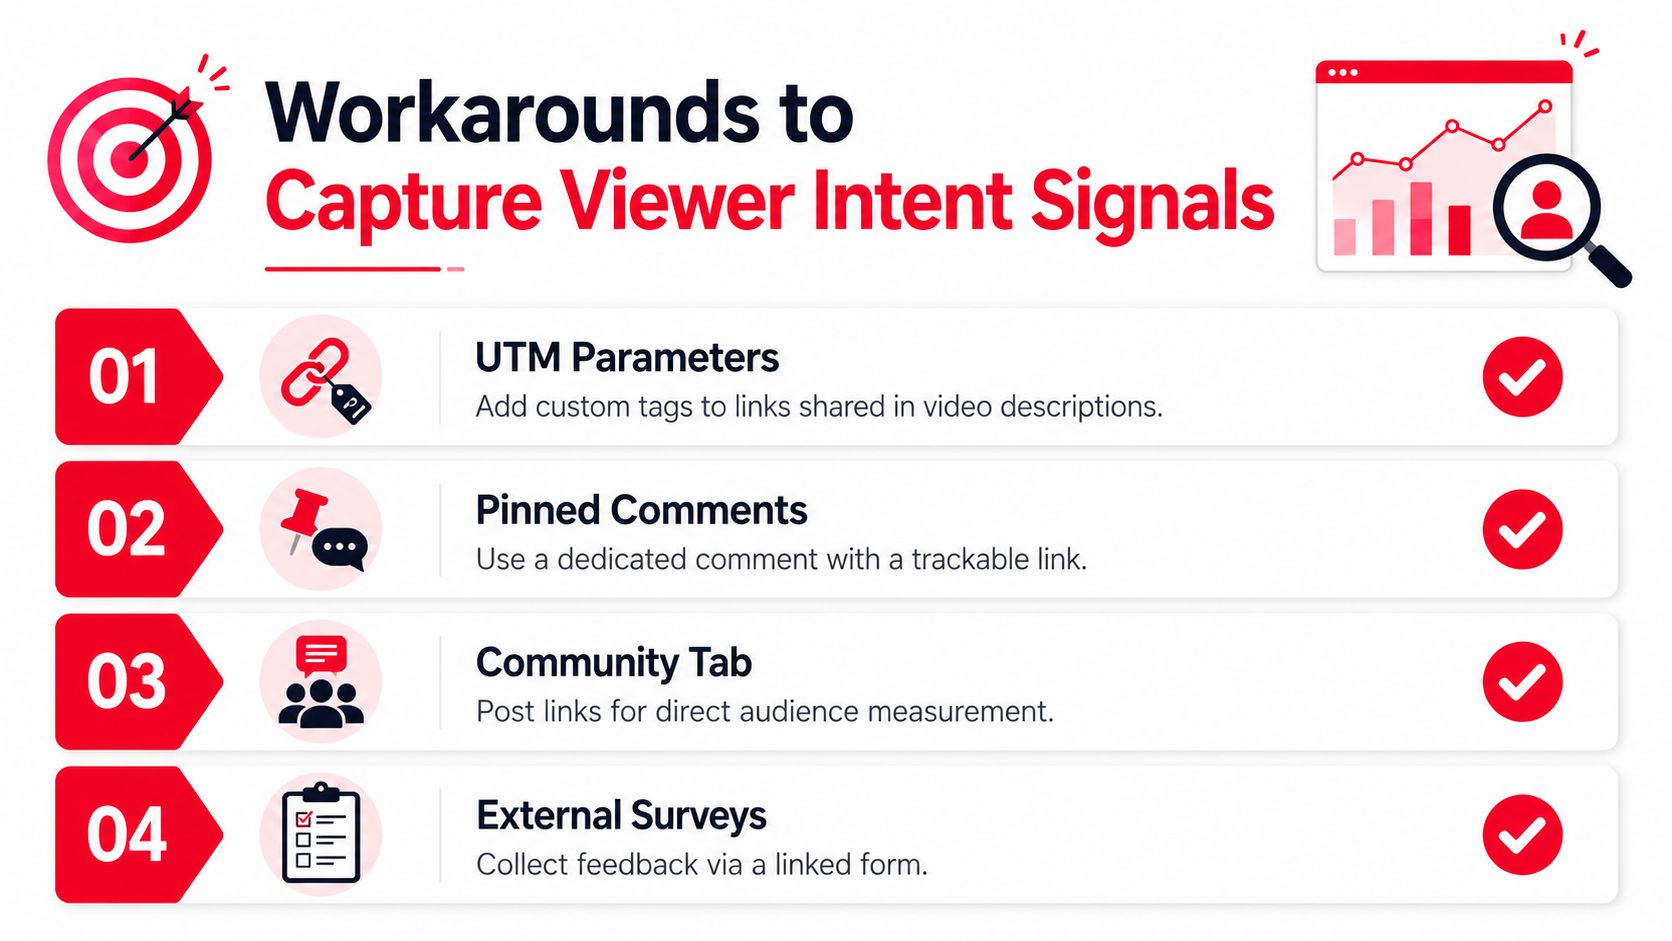
    An infographic titled Workarounds to Capture Viewer Intent Signals featuring four tips for tracking YouTube audience engagement.

    Turn voluntary actions into useful segments

    Track links by video. Create a distinct link for each upload, not just one link for the whole channel. This lets your analytics distinguish interest generated by a comparison video from interest generated by a beginner tutorial.

    Use gated content selectively. A downloadable checklist, worksheet, or extended resource can invite viewers to submit contact information. The form should explain what the person is requesting and how you'll use the information. Gating every resource creates friction, so reserve it for content with enough value to justify the exchange.

    Pin one focused comment. A pinned comment can act as an intent filter when it asks viewers to take one relevant action. Use a trackable destination and avoid sending people to several unrelated offers at once.

    Segment through community interactions. Community posts, polls, replies, and linked resources can reveal which subjects generate active interest. These actions still don't identify everyone who watched, but they can show which viewers choose to self-select around a topic.

    End screens provide another behavioral signal. A viewer who clicks from a tutorial into an advanced video has expressed a different interest from someone who watches only the original upload. Organize related videos into clear paths, such as beginner education, product comparison, implementation, and consultation.

    YouTube's analytics model is also placing more emphasis on the quality of viewing behavior. Recent YouTube help coverage discusses an “engaged views” metric in analytics, reinforcing the need to interpret viewing data as behavior rather than identity. The practical consequence is that raw view counts should sit beside watch patterns, clicks, comments, and downstream actions.

    Don't promise that every viewer will identify themselves. Most won't click, complete a form, or comment, and external analytics can measure only the people who take those actions. The value comes from combining partial signals consistently, then looking for repeated relationships between a topic, a viewer action, and a business outcome.

    Connecting Video Views to Revenue with ViewsMax

    A YouTube view is not a sale, and even strong retention doesn't prove that a video influenced revenue. The missing layer is attribution, a system that connects a specific piece of content to the clicks, leads, calls, or purchases that follow.

    ViewsMax provides that layer by letting creators create trackable links for offers, place those links in video descriptions, bios, and posts, and connect resulting activity back to the content that generated it. Instead of asking whether a video “performed,” you can inspect which content produced measurable commercial actions.
    Screenshot from https://blog.viewsmax.com

    A revenue-focused publishing loop

    Plan the offer before publishing the video. If the upload is a product tutorial, connect it to that product. If it answers a service question, connect it to a relevant consultation or lead form. Then use a distinct tracked link in the description and, where appropriate, the pinned comment or end-screen destination.

    After publishing, review the content and outcome together:

    • YouTube metrics: Views, watch time, retention, traffic sources, and returning-viewer behavior.
    • Intent actions: Link clicks, form submissions, calls booked, or other measured conversions.
    • Business outcome: Revenue attributed to the relevant content and offer.

    That comparison often changes editorial priorities. A high-reach video may introduce many people to the channel but produce little commercial activity. A narrower educational upload may attract fewer viewers while generating stronger buyer intent. Without attribution, the second video can look like a disappointment. With attribution, it may become the model for future content.

    ViewsMax also supports the surrounding workflow, including content planning, publishing across channels, and daily monitoring of clicks, calls booked, and attributed revenue. It isn't a tool for identifying individual YouTube viewers. It's a way to measure the voluntary actions that happen after viewers leave YouTube or follow an offer path.

    Revenue attribution doesn't replace YouTube Analytics. It completes it.

    Creators still need retention and audience reports to understand why a video attracts attention. They need external tracking to understand whether that attention turns into a business result. For broader on-page and discoverability considerations, the Chase McGowan video SEO guide offers useful context around improving the conditions that help videos get found.

    The important trade-off is measurement scope. YouTube can show broad audience behavior at scale, while an attribution system sees only trackable actions. Neither view is complete alone. Together, they show whether your content is building reach, earning attention, and contributing to sales. For creators evaluating the economics behind exposure, this guide to pay per 1000 views on YouTube can help separate view-based expectations from the broader commercial picture.

    Building Your Audience Intelligence Workflow

    A reliable workflow starts by assigning each tool a job. YouTube Studio explains audience composition and viewing behavior. External tracking captures voluntary intent. Revenue attribution connects those actions to business results. Trying to force one platform to answer all three questions creates bad analysis.

    Begin with a clean baseline. In YouTube Studio, record the Audience reports, returning versus new viewer patterns, traffic sources, and retention behavior for your important videos. Use the available 7-day, 28-day, and 90-day reporting slices for trend comparisons, remembering that unique-viewer reporting is limited to windows of up to 90 days for data quality, as documented in YouTube's unique viewers guidance.

    Then add one external action per commercial objective. A service channel might use a consultation link. A course creator might use a lesson or enrollment page. A product channel might use a specific offer page. Give every meaningful video its own tracking identity, and keep the call to action aligned with the promise made in the video.

    A practical operating rhythm

    At publishing: Check that the description link works, the destination matches the video, and the pinned comment gives viewers one clear next action.

    During review: Compare retention with clicks. If viewers watch closely but don't click, the offer or call to action may be poorly matched. If clicks are strong but leads or purchases are weak, inspect the landing-page experience and offer fit rather than changing the thumbnail immediately.

    During planning: Prioritize videos that combine audience fit, sustained viewing, and downstream action. A large view count with no measurable commercial response may still support awareness, but it shouldn't automatically receive more production effort than content that consistently creates qualified demand.

    Conflicting signals are normal. High views with low revenue can mean the topic has broad appeal but weak buying intent. Lower reach with strong attributed sales can indicate a valuable niche, a better offer match, or clearer viewer qualification. Use the conflict as a decision prompt, not as a reason to discard either metric.

    Keep the system lightweight enough to maintain. Start with native Audience and retention reports, then add tracked links to your priority offers. After the process becomes routine, compare content themes, traffic sources, viewer behavior, and attributed outcomes at the same time. That combination gives you a defensible answer to the original question: not the names of the people who watched, but which audiences engaged, what they wanted, and which videos helped create revenue.


    ViewsMax helps creators connect YouTube content to measurable actions through trackable links, content planning, publishing, and revenue attribution. Visit ViewsMax to see which videos are driving clicks, leads, calls, and sales instead of judging performance by views alone.
  • YouTube Watchtime Increaser: Proven Strategies

    YouTube Watchtime Increaser: Proven Strategies

    Most advice about a YouTube watchtime increaser starts in the wrong place. It tells creators to chase more views, publish longer videos, or accumulate raw watch hours as if every minute has equal commercial value. It doesn't. A passive viewer who watches half a broad entertainment video may contribute less to your business than a qualified prospect who watches a focused tutorial, clicks a tracked offer, and books a call.

    YouTube is already operating at enormous scale. Estimates for 2026 place daily viewing at roughly 1 billion to 2.43 billion hours, with average user time around 48.7 to 51.6 minutes per day, depending on the measurement method, as summarized by YouTube usage and watch-time data. That scale makes retention valuable, but it also makes measurement discipline essential. The practical question isn't how to generate more hours. It's which hours create return viewing, qualified clicks, leads, and sales.

    Why Raw Watch Hours Are the Wrong North Star

    Creators often treat monetization eligibility as the finish line, especially when they're focused on public watch hours. That threshold can be useful operationally, but it doesn't tell you whether your channel attracts the right audience or supports a viable business. A large total can conceal weak average view duration, early drop-offs, irrelevant traffic, and calls to action that nobody follows.

    A better model separates surface attention from qualified attention. Surface attention is the total time people spend with your content. Qualified attention comes from viewers who match your intended audience, reach the relevant part of the video, and take a meaningful next step. That step might be watching a related lesson, joining an email list, requesting a consultation, or purchasing an offer.

    YouTube Studio gives you the raw material for that diagnosis. Its Engagement report includes watch time and audience retention, while the retention calculation relates total watch time across views to the number of views and the video's length, as documented in YouTube's audience retention guidance. Average view duration, retention shape, traffic source, and downstream clicks tell you far more than a single accumulated number.

    Practical rule: Optimize the minute that precedes a valuable action, not merely the minute that inflates a dashboard.

    The distinction becomes clearer when you compare scenarios:

    Metric Type Example Scenario Business Outcome
    Raw watch hours Broad traffic watches passively but leaves without interacting High visibility with little commercial value
    Engaged watch time A relevant viewer reaches the solution and watches related content Stronger trust and deeper session behavior
    Attributed watch time A viewer watches, clicks a tracked offer, and becomes a lead Measurable contribution to pipeline or sales

    This is why a video with fewer total hours can outperform a high-volume upload commercially. A guide to public watch hours on YouTube helps clarify the eligibility metric, but eligibility shouldn't become your business strategy.

    YouTube's changing view-count environment reinforces the point. Recent coverage describes a global shift toward counting a view when playback starts, while monetization calculations continue to rely on qualified and engaged watch hours rather than inflated surface views, as reported by TechCrunch's coverage of YouTube's watch-hour update. Your reporting should therefore connect retention to outcomes. Track which videos produce clicks, leads, and sales, then give those videos more strategic attention than content that merely keeps people watching.

    Setting Realistic Retention Benchmarks by Format

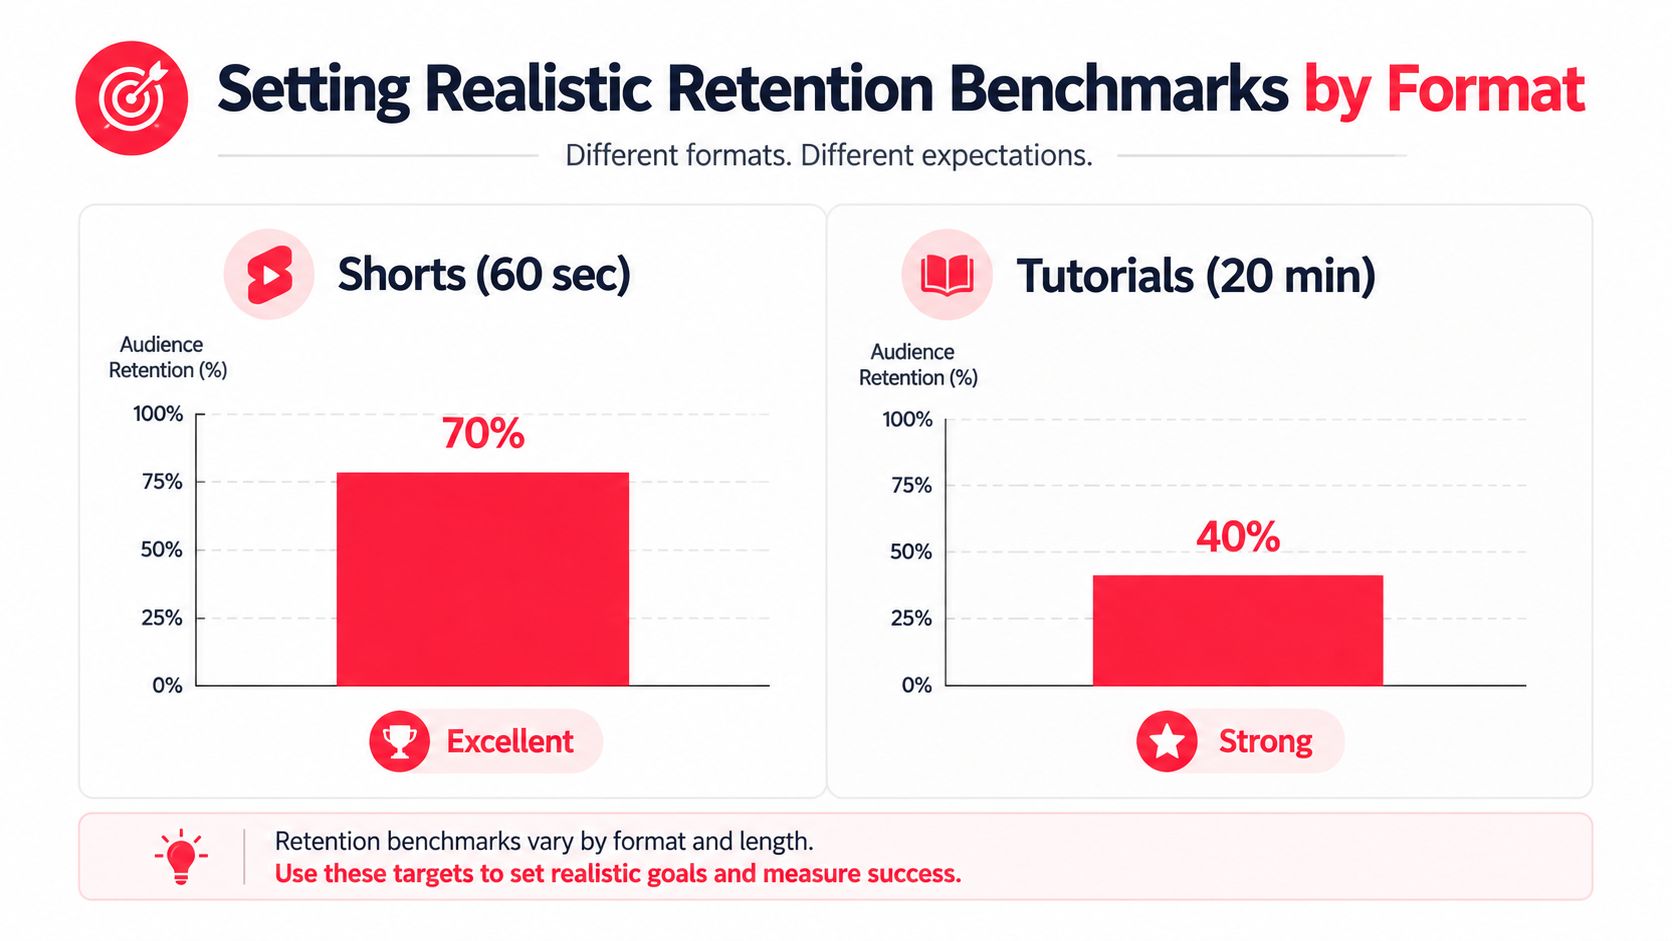
    Retention isn't a universal score. A short clip and a detailed tutorial ask viewers for different commitments, so comparing them against one global average creates bad decisions. Public 2026 benchmark summaries place strong retention around 65% to 75% for videos under 5 minutes, 50% to 60% for videos from 5 to 10 minutes, 40% to 50% for videos from 10 to 15 minutes, and 35% to 45% for videos longer than 15 minutes. Shorts often sit around 70% to 85%, according to 2026 YouTube retention benchmarks.

    A chart comparing audience retention benchmarks for 60-second YouTube Shorts versus 20-minute tutorial videos.

    Those bands aren't promises. They're diagnostic ranges. A 45% retention rate on a 12-minute educational video can sit in a healthy range, while the same percentage on a short-form clip would signal a weaker hold. The right comparison is always format, duration, topic, and audience intent together.

    Read the curve, not just the average

    The average percentage gives you a summary. The retention graph shows the story. A sharp opening decline usually points to a mismatch between the promise and the first moments of delivery. A gradual slide may indicate ordinary viewer filtering. A sudden mid-video dip can reveal a slow explanation, an irrelevant tangent, or a transition that asks too much patience.

    The first 15 to 30 seconds deserve special attention. Benchmark coverage reports that roughly 55% of viewers leave within the first minute, while average retention across the platform is about 23.7%, so an opening that confirms the click quickly has disproportionate value. Use the recommended video length guidance to keep runtime aligned with the amount of substance your topic can support.

    Build a channel-specific baseline

    Start by grouping videos into comparable sets. Separate Shorts, concise explainers, standard tutorials, long-form lessons, and livestream recordings. Then compare retention curves within each group rather than selecting a single target for the entire channel.

    Traffic source and device context matter as well. Search viewers may arrive with a precise problem, while Browse viewers may need faster confirmation that the video is relevant. A television viewer may accept a slower visual rhythm than someone watching on a phone. You don't need to force every format into the same retention shape. You need to identify the audience and structure that produce qualified attention.

    A 2018 study cited in benchmark discussions found limited evidence that higher percentage retention or average watch time per view necessarily leads to more views. That doesn't make retention unimportant. It means you should pair it with click-through rate, topic fit, session continuity, and conversion behavior instead of treating it as a standalone growth guarantee.

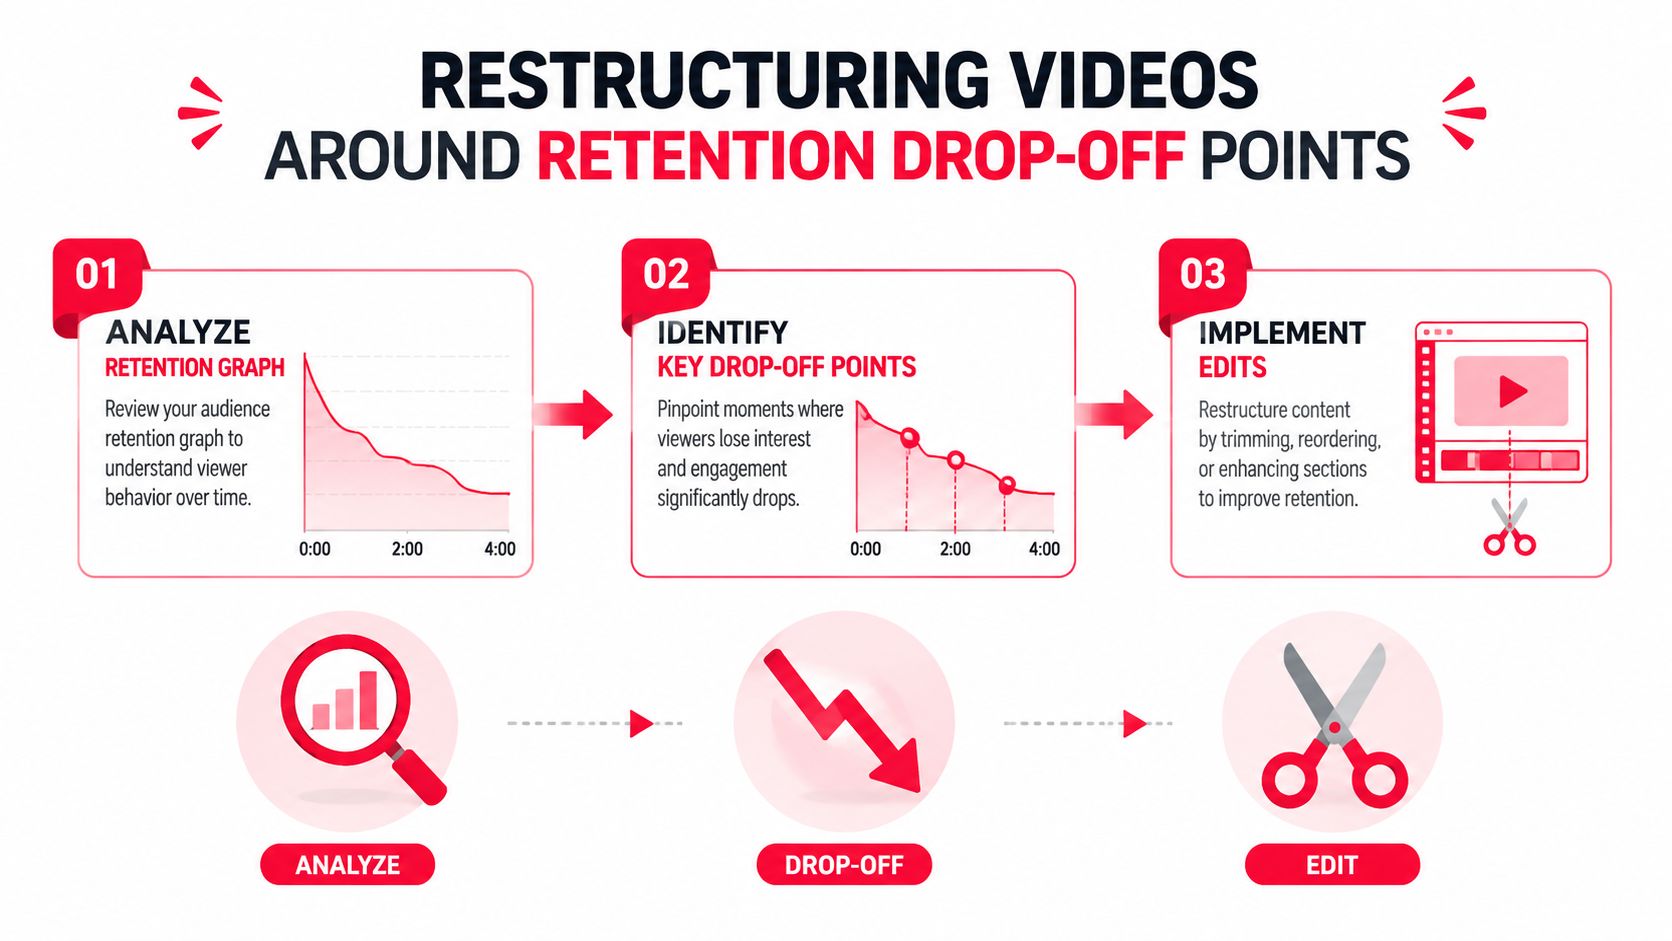
    Restructuring Videos Around Retention Drop-Off Points

    A retention graph becomes useful only when it changes your edit. Many creators open Analytics, notice a dip, and move on without watching the corresponding moment. The practical workflow is more direct: locate the loss, inspect the footage, identify the viewer's likely objection, and change the structure that caused it.

    An infographic showing a three-step process for restructuring videos to improve audience retention and viewer engagement.

    Start with the opening

    Open the video at the first steep decline. If viewers leave during the introduction, check whether you delayed the answer, repeated the title, inserted branding, or explained background before establishing the payoff. Rewrite the opening so it states the problem, names the result, and gives the viewer an immediate reason to continue.

    A strong opening doesn't need manufactured drama. It needs alignment. If the thumbnail promises a specific result, show evidence of that result early. If the title promises a process, demonstrate the first useful step before offering context.

    Diagnose the middle valley

    A middle-video dip often appears where the creator believes the viewer is already committed. That assumption leads to long transitions, repeated points, static visuals, or a sequence that no longer matches the original promise. Cut material that doesn't advance the viewer toward the outcome.

    Use a simple edit pass:

    1. Mark the timestamp: Note the exact point of the decline and the sentence or visual immediately before it.
    2. Review the promise: Ask whether the current segment still serves the title, thumbnail, and opening outcome.
    3. Change one structural element: Reorder a section, tighten a transition, replace a long explanation with a demonstration, or remove redundant context.
    4. Add a visual reset: Use relevant B-roll, a screen recording, a diagram, a camera-angle change, or on-screen text when the viewer needs a fresh representation of the idea.
    5. Compare future uploads: Don't attribute every improvement to one edit unless the test isolates that variable.

    Pattern interrupts can help, but they shouldn't become decoration. A cut, zoom, or graphic only earns its place when it clarifies the idea or restores attention. Random motion may hold the eye briefly while weakening comprehension, which is a poor exchange for educational and commercial content.

    A drop-off isn't automatically a failure. If a section filters out viewers who aren't qualified for your offer, preserving the right audience may be more valuable than retaining everyone.

    Treat the final section as a bridge

    A sharp decline near the CTA often means the recommendation arrived too late or feels disconnected from the video. Introduce the next step while the viewer is still engaged, then make the offer specific to what they just learned. A tutorial about a problem should lead to the next tutorial, resource, or offer that solves the natural follow-up problem.

    Don't hide the useful material until the final seconds just to manufacture completion. That tactic may increase shallow completion while damaging trust. Put the first payoff early, build the explanation around useful progression, and use the ending to direct qualified viewers toward a relevant next action.

    The following video demonstrates the broader principle of using structure and editing decisions to protect engagement:

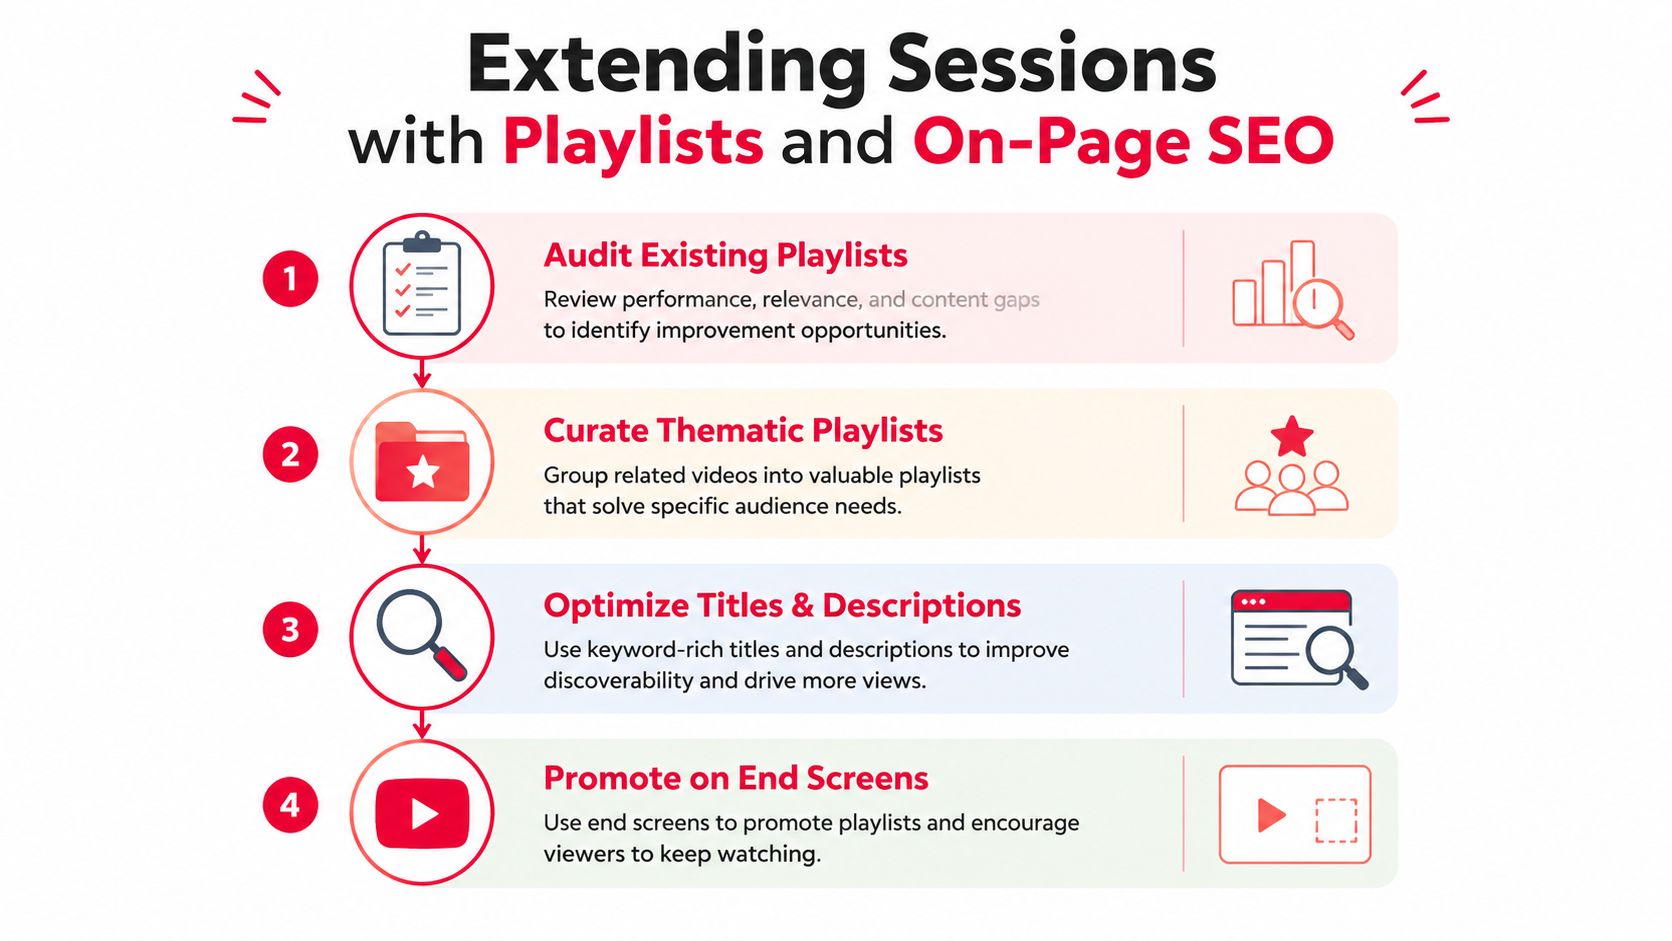
    Extending Sessions with Playlists and On-Page SEO

    A playlist shouldn't function as a storage folder. It should answer the viewer's next question before they leave the platform. The strongest structures reflect intent, not upload chronology. A beginner lesson can lead to implementation, troubleshooting, and a decision-oriented video, creating a coherent path through the channel.

    Design around viewer intent

    Audit existing playlists first. Remove duplicate themes, fix misleading titles, and separate videos that attract completely different audiences. Then build clear sequences such as:

    • Awareness: Explain the problem and define the vocabulary.
    • Consideration: Compare approaches, tools, or workflows.
    • Decision: Demonstrate implementation, outcomes, or the next commercial step.

    Put the strongest session-start video first. It should make sense to a new viewer, deliver an early result, and create a natural reason to continue. The second video should resolve a follow-up question rather than being the next upload chronologically.

    If you need a practical reference for playlist setup and organization, the BeyondComments YouTube playlist guide offers a useful operational walkthrough. The strategy still depends on editorial judgment. A technically correct playlist with no narrative momentum won't hold attention.

    Optimize the playlist as a search asset

    Write titles around the shared viewer problem, then use the description to explain what the sequence covers and who should watch it. Include related language naturally, but don't turn the description into a keyword list. Search optimization works best when the playlist accurately describes a useful viewing path.

    Apply the same principle to the surrounding page elements. Place a contextual next-video link in the description, pin a comment that names the next logical lesson, and use end screens to continue the exact journey. If a viewer watched a setup tutorial, don't send them to an unrelated popular upload because it has more views.

    Chapters can improve navigation when they help a viewer find a relevant segment without making the video feel fragmented. Use this guide to adding YouTube chapters to structure longer lessons clearly, then make the chapter sequence support the playlist's broader progression.

    A four-step infographic showing how to extend YouTube session watch time using playlists and on-page SEO strategies.

    ViewsMax's keyword scoring and tag analysis tools can be used alongside YouTube Studio to evaluate playlist themes, adjacent search intent, and content opportunities. The important practice is to connect discovery with session design. A playlist that earns a search impression but fails to move viewers into a relevant second video hasn't solved the watch-time problem.

    Building a Testing and Attribution Feedback Loop

    Watch time without attribution is incomplete reporting. You need a feedback loop that connects the creative decision, the audience response, and the business action. That means testing one meaningful change at a time, reviewing the retention curve, and tracing qualified viewers beyond the video.

    Start with a testing log. Record the video, audience promise, variable changed, launch context, retention observations, clicks, leads, and sales. YouTube's built-in title testing can help isolate packaging decisions, while editorial tests should focus on the opening, segment order, pacing, or CTA placement. Don't change the hook, thumbnail, title, and offer simultaneously if you want to know which decision affected the result.

    Separate content problems from audience problems

    A dip during a technical explanation may indicate that the explanation needs a clearer example. A strong opening followed by weak downstream clicks may indicate that the video attracts curiosity without attracting buying intent. A steady retention curve paired with poor conversion can point to offer mismatch, unclear positioning, or a CTA that asks for too much commitment.

    The answer depends on the relationship between signals. High retention with low click activity isn't automatically a success. It may mean viewers enjoyed the content but had no reason to continue commercially. Conversely, a modest total audience can still produce valuable results when the viewers who remain are a close match for the offer.

    Track the action after the view

    Use a unique UTM-tagged link for each video or campaign placement. Put it in the description, pinned comment, or relevant on-screen destination, then connect those visits to your analytics and CRM. Record not just clicks, but lead submissions, calls booked, purchases, and the content that introduced or assisted the conversion.

    Test Variable What to Measure Attribution Signal
    Opening promise Early retention and average view duration Clicks from viewers who reached the first offer mention
    Segment order Retention at each major section Leads from viewers exposed to the revised sequence
    CTA placement Retention around the CTA and link clicks Offer visits, inquiries, or purchases
    End-screen destination End-screen clicks and next-video starts Continued session plus later conversion activity

    A useful dashboard places these signals beside one another rather than burying them in separate reports. ViewsMax can provide an attribution layer with trackable links that connects activity back to specific content, allowing creators to compare watch behavior with clicks, leads, and attributed sales. That makes the optimization question concrete: which video deserves another edit, another promotion, or a follow-up offer?

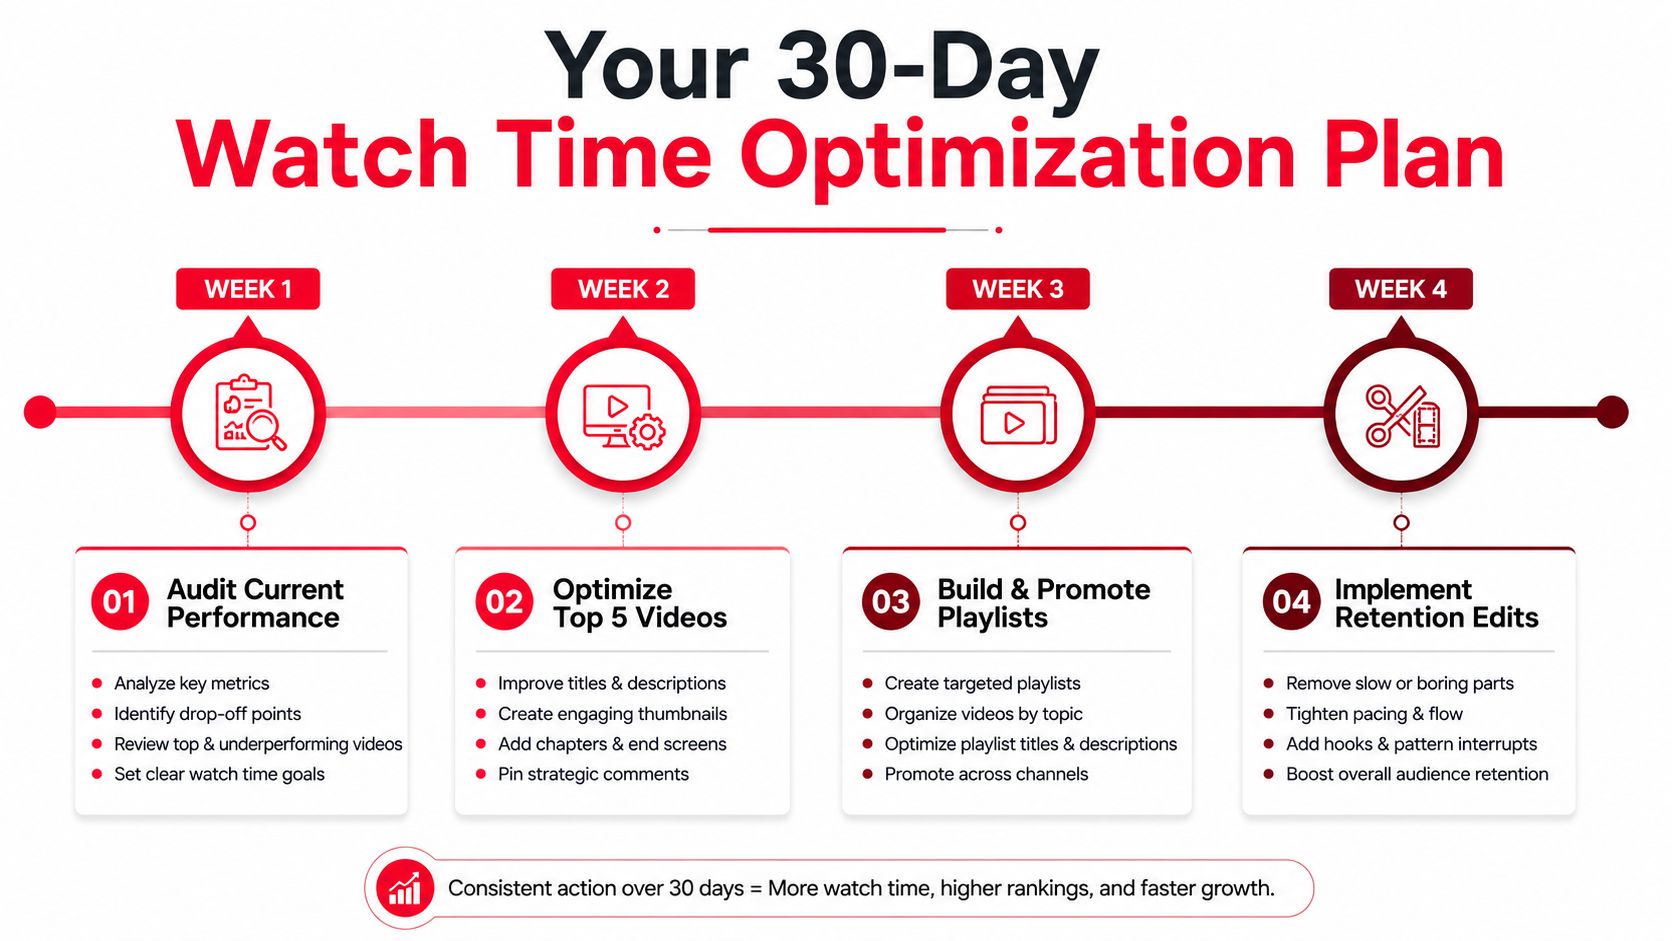
    Your 30-Day Watch Time Optimization Plan

    A month is enough to establish a disciplined workflow, not enough to declare a permanent winner. Use the first week to audit your library, starting with videos that already receive meaningful impressions or traffic. Pull the retention curves, average view duration, click-through data, and conversion activity, then mark the recurring points where viewers leave or stop taking action.

    A 30-day plan infographic illustrating steps to optimize and improve YouTube watch time through four weeks.

    Week one, audit current performance

    Create a simple inventory of your strongest existing videos. Look for repeated opening problems, mid-video stalls, weak transitions, and CTAs that attract little response. Don't begin with videos that have no meaningful audience signal. High-traffic assets give you clearer evidence and a larger opportunity for improvement.

    Week two, optimize the top five candidates

    Rewrite and re-edit the first moments of the five videos with the best combination of audience relevance and business potential. Remove slow setup, show the promised outcome earlier, and tighten the path to the first useful payoff. Keep the creator's natural voice. Over-editing can make a trustworthy expert sound like a trailer narrator.

    Week three, build the viewing paths

    Create intent-based playlists and connect them with descriptions, pinned comments, verbal recommendations, and end screens. Check every link and destination from a viewer's perspective. The next video should feel inevitable, not random.

    Week four, launch the feedback loop

    Document a single test for each selected video, attach unique tracking links to relevant offers, and review both retention and downstream behavior. Give the data enough time to become interpretable. Early movement can be noise, especially when traffic sources change.

    For additional tactical ideas, these proven watch-time tactics from Thumbo AI can supplement your testing backlog. Avoid buying artificial watch time or using tactics that attract viewers who have no relationship with your subject. Inflated hours don't establish qualified demand, and they can obscure the signals you need to make sound editorial decisions.

    Use progress tracking to compare the original structure with the revised version, but judge success on more than total hours. A valuable improvement may appear as stronger retention among the intended audience, more next-video starts, better link engagement, or additional attributed leads even when overall views remain stable.


    ViewsMax helps creators plan content, publish across channels, and connect trackable links to clicks, leads, and sales, so watch time can be evaluated as a business signal rather than a vanity total. Visit ViewsMax to see how your YouTube content can be tied to the actions and revenue it generates.