Welcome to your no-nonsense guide to understanding YouTube view stats. If you've ever stared at your YouTube Analytics dashboard and felt like you were trying to read a foreign language, you're not alone. This guide is your translator, designed to turn those confusing numbers into your single most powerful tool for growing a successful channel.
From Views to Victory: Decoding Your Channel’s Performance

Ever wonder why one of your videos takes off like a rocket while another one just… sits there? The answer is always buried in the metrics. We're going to dig into the core numbers that truly define your channel's health, looking far beyond the simple view count to see what actually keeps people watching and coming back for more.
You won't just learn what each number is; you'll learn the story it tells about your content and your audience. We'll break down how YouTube actually counts a view, show you exactly where to find this crucial data, and most importantly, teach you how to use it to make smarter videos.
The Core Metrics at a Glance
Before we dive deep, let's start with a quick overview of the essential YouTube stats every creator needs to know. Understanding these five pillars is the first step to mastering your analytics and building a content strategy that works.
| Metric | What It Measures | Why It's Important For Growth |
|---|---|---|
| Views | The number of legitimate, intentional plays a video receives. | A basic measure of reach, but it's just the tip of the iceberg. |
| Watch Time | The total accumulated minutes viewers have spent watching your video. | A critical signal to YouTube's algorithm that your content is engaging and valuable. |
| Impressions | How many times your video's thumbnail was shown to viewers on YouTube. | Represents your video's potential reach and visibility across the platform. |
| Click-Through Rate (CTR) | The percentage of impressions that turned into a view. | Shows how effective your title and thumbnail are at grabbing attention. |
| Unique Viewers | The estimated number of individual people who watched your videos. | Helps you understand the actual size of your audience versus repeat viewers. |
Think of these as your channel's vital signs. Each one tells you something different, and when you look at them together, you get a complete picture of your channel's health and potential.
Your Massive Potential Audience
It’s easy to forget just how enormous YouTube really is. To give you some perspective, the platform's active user base is projected to hit 2.54 billion by July 2025. That’s nearly half of all internet users on the entire planet.
This audience is spread across the globe, with massive concentrations in countries like India and the United States. You can read more about the platform's global reach to get a better sense of this scale.
That staggering number is exactly why mastering your view stats is non-negotiable. You aren't just uploading videos; you're competing for attention in a global arena. Your data is what gives you an edge.
Key Takeaway: Your analytics are the voice of your audience. Learning to listen is how you create content that truly connects, keeps people engaged, and builds a loyal community that lasts.
By the time you finish this guide, you’ll be ready to turn that raw data into a real strategy. Let's get started.
So, What Actually Counts as a View?
The "view" is the most basic metric on YouTube, but what does it really mean? It's not as simple as someone just clicking on your video. To really get a handle on your analytics, you need to first understand what YouTube considers a legitimate view—and what it throws out.
Think of it like a bouncer at a club. Just because there's a line outside doesn't mean everyone gets in. The bouncer is there to filter out the trouble and only let legitimate guests through. YouTube's view-counting system does the same thing, making sure every view it counts comes from a real person who actually wants to watch.
The Famous 30-Second Rule
You've probably heard of the "30-second rule," and it's the core of how YouTube counts views. For a view to be logged on your video, someone has to watch it for at least 30 seconds. This is YouTube's way of gauging a viewer's intent. A 30-second watch shows they didn't just click by accident; they made a real decision to stick around.
But what about videos shorter than 30 seconds? In that case, a view is counted if someone watches nearly the entire video. This way, short, snappy content still gets credit for the engagement it generates. This time-based filter is the first and most important step in separating a real view from a fleeting click.
This isn't just a technicality. It's how the algorithm learns what people genuinely find interesting. A click is momentary, but a 30-second watch tells YouTube that your thumbnail and title delivered on their promise, creating a good experience that's worth recommending to others.
Intent is Everything
Beyond the stopwatch, YouTube's system is built to measure intentional plays. This means a real human has to be the one who hits the play button.
YouTube’s primary goal is to count views from real people, not bots. The system is constantly being refined to filter out low-quality or artificial plays, keeping the platform fair for creators, advertisers, and viewers.
To make this happen, YouTube has some pretty sophisticated ways of spotting and tossing out what it calls "invalid traffic." This is a catch-all for any interaction that isn't a genuine, human-initiated view.
Here’s what gets filtered out:
- Automated Plays: Any view coming from a bot, script, or shady software designed to pump up numbers gets the boot.
- Your Own Views: Sorry, but hitting refresh on your own video page over and over won't work. YouTube is smart enough to know it's you and won't count those plays.
- Embedded Autoplays: If you embed a video on a website and it starts playing automatically, that view often won't count unless the user actually interacts with the player (like unmuting or clicking to expand).
What This Means for Your Analytics
This tough filtering process is exactly why you might notice your view count jump around or even drop in the first 48 hours after you publish a video. That's just YouTube auditing the initial wave of traffic, carefully separating the real views from the noise.
Knowing this is super important. It means the final view count you see in YouTube Analytics isn't just a raw tally of clicks. It's a validated number that represents real people who intentionally chose to watch your work. With that in mind, you can trust the data and start diving into the more complex metrics with confidence.
The Metrics That Matter Most for Channel Growth
Let's be real: chasing a high view count is vanity. While it feels good to see a big number, the smartest creators know that the YouTube algorithm looks for much deeper signals of viewer satisfaction. These are the metrics that actually tell the story of your channel's health and pave the way for real, sustainable growth.
Think of it this way: a single view is like someone knocking on your door. That's a great start, but what you really want is for them to come inside, kick off their shoes, and stay for a while. The stats that measure that kind of behavior are the ones that truly move the needle.
So, let's break down the numbers that separate a fleeting click from a dedicated fan. The diagram below shows how a simple click evolves into a validated YouTube view, which requires a viewer's action, genuine intent, and a minimum time commitment.
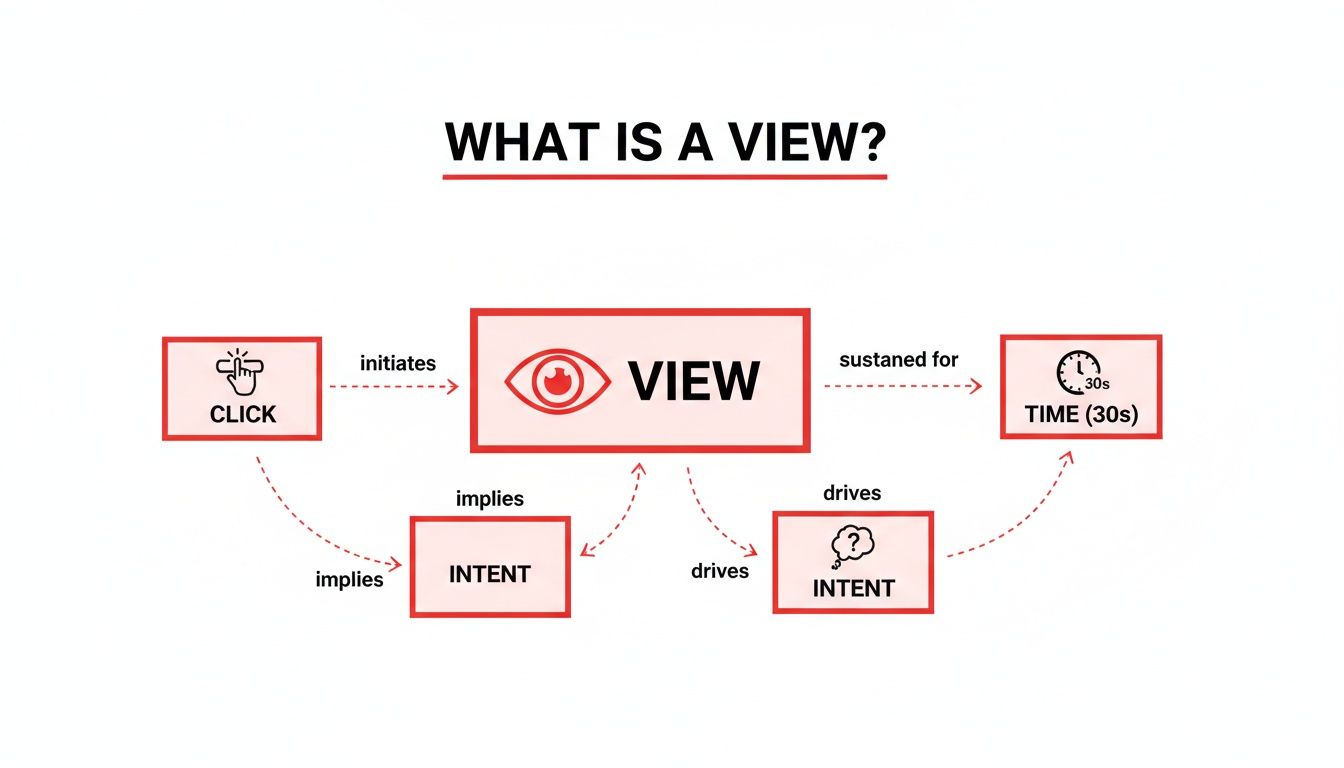
This process makes it clear that a view isn't just a passive number—it's an active measure of someone's initial commitment to your content.
Watch Time: The Undisputed King
If you obsess over just one metric, make it Watch Time. This is the total, cumulative time people have spent watching your videos. To the algorithm, a high Watch Time is the ultimate signal that your content is valuable and is keeping people on the platform.
Just look at this simple comparison. Imagine two videos, both with 10,000 views:
- Video A is 2 minutes long, and people watch for 30 seconds on average. Total Watch Time: 5,000 minutes.
- Video B is 10 minutes long, and people watch for 5 minutes on average. Total Watch Time: 50,000 minutes.
Despite having the same number of views, Video B is ten times more powerful in the eyes of YouTube. It did a much better job of holding attention, which is exactly what YouTube wants. Consistently high Watch Time is your golden ticket to getting recommended in Browse and Suggested videos. If you're looking to dive deeper, you can check out our guide on boosting your YouTube watch hours.
Average View Duration: Your Content's Holding Power
While Watch Time is the grand total, Average View Duration (AVD) tells you how long the typical viewer sticks around. It’s a simple calculation: total Watch Time divided by the total number of views.
Think of AVD as your content's report card. A high AVD means your video is successfully gripping viewers, while a low AVD is a clear sign that people are bouncing early. This could be because your intro is too slow, the content doesn't deliver on the title's promise, or the pacing just feels off. Keeping a close eye on your AVD helps you pinpoint exactly where you’re losing people so you can make better videos next time.
A high Average View Duration is direct feedback from your audience saying, "Yes, this is what I wanted to see." It's one of the strongest indicators of content quality and viewer satisfaction.
Impressions and Click-Through Rate: Winning the First Click
Before anyone can rack up Watch Time, they first have to see your video and decide to click on it. This is where Impressions and Click-Through Rate (CTR) come in.
- Impressions: This is simply the number of times your video's thumbnail was shown to a potential viewer on YouTube.
- Click-Through Rate (CTR): This is the percentage of those impressions that actually turned into a click (and a view).
Your thumbnail and title are basically a billboard on the YouTube highway. Impressions are how many cars drive past it, and your CTR is the percentage of those cars that pull over to check you out. A low CTR means your "billboard" isn't compelling enough, no matter how amazing the content is behind that click. These two metrics are a team; you can't get views without impressions, and you can't capitalize on those impressions without a strong CTR.
Putting It All Together: What the Data Is Telling You
These metrics don't live in isolation. They all work together to paint a complete picture of your video's performance, and understanding how they influence each other is where the magic happens.
For instance, a high CTR paired with a low Average View Duration is a classic red flag. This tells you that your thumbnail and title made a promise that the video didn't keep. People were intrigued enough to click, but they left almost immediately because the content wasn't what they expected. This is the hallmark of "clickbait," a practice that can seriously hurt your channel's reputation with the algorithm over time.
To help you connect the dots, here’s a look at some common scenarios and what they might be telling you.
Interpreting Metric Combinations
Understanding how metrics influence each other is key. This table shows common scenarios and what they likely mean for your video's performance.
| Scenario | What It Likely Means | Recommended Action to Take |
|---|---|---|
| High CTR, High AVD | You've hit the jackpot! Your topic, title, and thumbnail perfectly align with compelling content. | Double down on this format and topic. Analyze what made it successful and replicate it. |
| High CTR, Low AVD | Classic clickbait problem. Your packaging is great, but the content doesn't deliver on its promise. | Revise your titles and thumbnails to be more honest, or improve your video's intro to hook viewers faster. |
| Low CTR, High AVD | Your content is fantastic, but nobody's clicking to find out. Your thumbnail and title aren't doing their job. | A/B test new thumbnails and titles. Make them more intriguing, clear, and relevant to your target audience. |
| Low CTR, Low AVD | The video is underperforming across the board. The topic may not be interesting, or the execution is weak. | Re-evaluate your content strategy. Research what's working for others in your niche and find a new angle. |
By learning to read these combinations, you can stop guessing and start making data-informed decisions to improve every video you publish.
Finally, remember to benchmark your performance against others in your niche. While the average YouTube video gets around 5,594 views, this varies wildly. Entertainment channels can pull in nearly 10,000 views per video, while gaming channels might see closer to 3,000. Knowing the baseline for your category helps you set realistic goals. Tools like ViewsMax are designed to help you analyze these benchmarks and refine your content strategy to meet and exceed them.
How to Navigate YouTube Analytics Like a Pro
Knowing your metrics is one thing, but knowing where to find them and how to make sense of the data is where the magic happens. At first glance, YouTube Studio can feel a bit overwhelming, but it's not a scary spreadsheet—it's your channel's command center. Once you get the hang of it, you'll see it as your most powerful tool for growth.
Your starting point is always YouTube Studio. Just hop onto your dashboard and click "Analytics" in the menu on the left. This is your gateway to understanding exactly how your channel is performing. You’ll land on the Overview tab, which gives you a great high-level summary of your key youtube view stats.
Here's a look at what you can expect to see on a typical channel analytics overview.

This snapshot shows your views, watch time, and subscriber changes, making it easy to spot big trends without having to dig around for them.
Exploring the Core Analytics Tabs
You'll spend most of your time moving between four key tabs: Reach, Engagement, Audience, and Revenue. Each tab tells a unique part of your channel’s story.
- Reach Tab: This is all about how people find your videos. It's home to your Impressions, Click-Through Rate (CTR), and, crucially, your Traffic Sources.
- Engagement Tab: Here's where you find out what happens after someone clicks. This tab holds your Watch Time and Average View Duration.
- Audience Tab: This is where you get to know who is watching. It gives you the details on your Unique Viewers, returning viewers, and audience demographics, including when they're online most often.
Think of it this way: Reach is your marketing team getting people in the door. Engagement is your product team making sure they have a great experience. And Audience is your research team figuring out who your customers really are.
Using Filters to Uncover Insights
The real power of YouTube Analytics comes alive when you start playing with filters. The default view shows data for the last 28 days, but that's just the beginning.
In the top-right corner, you can click the date range to change the time frame. You can zoom in on the last 7 days to check recent performance, look at the last 90 days for a bigger-picture review, or set a custom range to see how things have gone since you changed up your content strategy. Comparing periods—like this month versus last month—is a fantastic way to see if your hard work is paying off.
Pro Tip: Don't get stuck only looking at your channel as a whole. Go to the "Content" tab and click on an individual video to see its specific analytics. This is where you'll figure out exactly what makes a video a hit or a miss.
Mastering Advanced Mode
Ready to go deeper? Clicking on "Advanced Mode" unlocks a whole new level of analysis. It lets you compare different metrics side-by-side, add secondary data points, and build custom reports.
For example, you could compare the Average View Duration for all the videos you published last month to see which topics really kept viewers hooked. Or, you could break down the Traffic Sources for your top-performing videos to learn if they're being found through YouTube search or suggested videos.
When you know where your best viewers are coming from, you can start making more content that plays to those strengths. If you want to take it a step further and see how your interaction stacks up, you can use a YouTube engagement rate calculator to benchmark your performance.
Getting comfortable with these tools helps you go from just looking at your youtube view stats to actively using them to build a content plan that truly works.
Turning Your Insights Into a Winning Content Strategy
All this data is useless if you don't act on it. Understanding your YouTube view stats is the first step, sure, but real growth happens when you start turning those numbers into a smarter content plan. This is the moment you shift from just watching your analytics to actually using them as a creative compass.
Think of your analytics dashboard less like a report card on your past work and more like a roadmap showing you exactly where to go next. Every metric is a breadcrumb your audience left behind, pointing you toward the stuff they genuinely want to watch.
High Impressions but Low Clicks: A First-Impression Problem
One of the most common headaches for creators is seeing a ton of impressions but a disappointingly low Click-Through Rate (CTR). This means YouTube is putting your video in front of plenty of people, but hardly anyone is biting. You've got the reach, but you're missing that crucial initial hook.
This isn't necessarily a problem with the video itself—it's a packaging problem. Your thumbnail and title are your video's billboard on the digital highway. If cars are just driving by, you need to change the sign, not rebuild the entire store.
Here's how to figure out why your packaging isn't earning that click:
- Is the Thumbnail Clear? Can someone get the main idea of your video in two seconds just by glancing at the thumbnail? Ditch the clutter, use big text, and show expressive faces or compelling imagery.
- Does the Title Spark Curiosity? A great title makes a promise or asks a question that the viewer feels they need to have answered. Generic titles get lost in the noise.
- Do They Work Together? Your thumbnail and title should be a one-two punch. They need to complement each other, not just repeat the same information. Together, they should tell a tiny story that makes clicking irresistible.
Systematically testing and tweaking your titles and thumbnails is the most direct way to fix a low CTR. For a much deeper dive, check out our guide on how to improve click-through-rate for some really practical techniques.
High Clicks but a Sharp Drop-Off: The Content Mismatch
So what if you have the opposite problem? A fantastic CTR, but your Average View Duration is in the gutter. People are clicking like crazy, but they're bailing almost immediately. This is a classic sign of a mismatch between what you promised and what you delivered.
This "bait-and-switch" can seriously poison your channel over time. It signals to the YouTube algorithm that your videos create a bad viewer experience, which can get your content suppressed in recommendations down the line. The fix? Make sure your video keeps the promise your title and thumbnail made, right from the very start.
Your first 15 seconds are everything. You have to immediately confirm to the viewer that they made the right choice by clicking, delivering on the hook you promised them.
Go back and watch the first 30 seconds of your videos with low watch time. Do you waste time on a long, fancy intro? Do you ramble before getting to the point? Cut the fluff. Get straight to the value and you'll stop that initial viewer exodus. And remember, interpreting the numbers is just one part of the equation; you also need to apply those insights, like figuring out the best time to upload YouTube videos to catch your audience when they're most likely to be online.
Thriving in a Crowded Ecosystem
Making smart, data-driven decisions is more important today than ever before. YouTube is unbelievably crowded. By the end of 2025, the platform was home to an estimated 29 billion videos. Much of that explosive growth is fueled by Shorts, which now make up over 90% of all new uploads.
In this hyper-competitive world, the top 1% of videos command an incredible 91% of all viewing time. That leaves the other 99% of us fighting for the remaining 9% of attention.
These numbers paint a pretty clear picture: you can't just get lucky anymore. Success demands a strategic approach where your YouTube view stats inform every single decision. This is where tools like ViewsMax come in, helping you make sense of the noise with data-backed suggestions for titles, tags, and descriptions. It's about creating a powerful feedback loop where analytics directly fuel your creative process, turning your dashboard into a command center for real channel growth.
Time to Put Your Data to Work
We've covered a lot of ground, from what a "view" actually means to the deeper metrics that drive real channel growth. If there's one thing you take away from all this, let it be this: your YouTube view stats are your audience speaking directly to you. When you learn to listen, you gain the power to create content that doesn't just get watched, but gets people talking and subscribing.
This isn't about chasing empty numbers. It's about seeing the story behind the stats. By keeping a close eye on your Views, Watch Time, and Click-Through Rate, you can stop throwing content at the wall to see what sticks. The "publish and pray" era is over.
From Numbers to Know-How
With the information you can pull from your dashboard, you now have a roadmap. Your next hit video won't be a happy accident; it’ll be the product of a smart, analytical, and creative strategy. Every data point is a breadcrumb leading you toward what your audience truly wants.
Think of your analytics dashboard less like a report card and more like a treasure map. It shows you exactly where your audience wants to go next. Make it your most trusted creative partner.
This shift in thinking helps you get ahead of trends instead of just reacting to them. To make sure the map is accurate, it's crucial to focus on mastering data quality monitoring. When you can trust your numbers, you can make decisions with complete confidence.
Your Next Step with ViewsMax
Of course, digging through raw data can feel like a full-time job. That's where a tool like ViewsMax comes in handy. We built our platform to do the heavy lifting, turning complex analytics into straightforward, actionable advice.
- Pinpoint Your Best Topics: We analyze your metrics to show you which content ideas have the most potential.
- Nail Your First Impression: Get AI-powered feedback on titles and thumbnails to get more people clicking.
- Sharpen Your Strategy: Use our insights to build a powerful feedback loop, making each video better than the one before it.
When you combine your creative spark with solid data, you've got a recipe for serious growth. It’s time to stop guessing and start knowing. Your journey to becoming a data-savvy creator starts right now.
A Few Common Questions About YouTube View Stats
If you've spent any time staring at your YouTube view stats, you've probably had a few head-scratching moments. It's totally normal. Getting to grips with the platform's reporting can be tricky, but understanding the quirks will save you a ton of stress and help you make smarter moves for your channel.
Let's break down some of the most common questions we hear from creators.
Why Did My YouTube Views Suddenly Drop?
That feeling when you see a sudden drop in views? It’s a gut punch, but it's rarely random. There's almost always a logical reason hiding in your analytics. Before you panic, think about seasonality. Major holidays, the start or end of the school year, or even big world events can throw viewing habits for a loop, causing temporary dips.
If it's not the calendar, your next stop should be the Traffic Sources report in YouTube Analytics. If you see a slump in impressions from "Browse Features" or "Suggested Videos," that's a big clue. It likely means the algorithm's recommendations have shifted. It's also worth looking at your last few uploads—a couple of duds can easily drag down your channel's momentum and pull your average view count down with them.
How Long Does It Take for YouTube Analytics to Update?
When it comes to your stats, a little patience goes a long way. YouTube Analytics isn't instant because it has a ton of data to chew on and verify.
- Real-time Stats: This is your early look, showing estimated views for the first 48 hours. Think of these numbers as a rough draft—they're useful, but not final.
- Finalized Data: The official, locked-in numbers for views, watch time, and revenue usually show up after a 48-hour delay. During this time, YouTube is busy filtering out spammy views and bot traffic to make sure everything is legitimate.
So, for the most reliable take on a video's performance, it's always best to wait at least two full days before you start making big decisions based on the numbers.
Can I See Exactly Who Viewed My YouTube Videos?
The short answer is no. You can't see a list of the specific user accounts that have watched your videos. YouTube takes viewer privacy seriously and keeps all of that information anonymous.
But what you can see is actually much more powerful for growing your channel. Head over to the "Audience" tab in your analytics. There, you'll find a goldmine of aggregated data: your viewers' general age ranges, their gender distribution, and the top countries they're watching from. This gives you a crystal-clear profile of your audience without ever creeping on individuals.
Understanding your audience demographics is way more valuable than knowing individual names. It helps you shape your content, your tone, and even your video topics to connect directly with the people who are actually tuning in. That's how you build real engagement and growth.
What Is a Good Click-Through Rate on YouTube?
This is the million-dollar question, but there's no single magic number for a "good" Click-Through Rate (CTR). It really depends on your niche, the video topic, and where the viewer is coming from. For example, a video found via YouTube Search will almost always have a higher CTR than one suggested on the homepage, simply because the searcher came looking for it.
With that in mind, a CTR between 4% and 5% from impressions in Browse and Suggested is a pretty solid benchmark for many channels. Instead of fixating on a universal number, focus on improving your own channel's average. Dive into the analytics funnel to see how well your thumbnails and titles are turning impressions into actual views, and don't be afraid to experiment to see what your audience clicks on.
Ready to stop guessing and start growing? ViewsMax translates complex analytics into clear, actionable advice to help you create videos that get discovered, watched, and loved. Start making data-driven decisions today at ViewsMax.