ViewsMax
Sign In Sign Up Free

Author: development@iclicksee.com

  • Social Media Analytics Dashboard: Key Metrics for 2026

    Social Media Analytics Dashboard: Key Metrics for 2026

    You open Instagram Insights and see a healthy spike. Reach is up, profile visits look promising, and the engagement rate gives you a satisfying green arrow. Then you open your store, email platform, or CRM and face the question the native dashboard can't answer: which post created the sale?

    A social media analytics dashboard should close that gap. It isn't merely a screen for collecting likes, impressions, and follower counts. Properly designed, it connects platform activity with funnel movement, attribution, and revenue, while preserving each network's definitions and counting rules. The result is a decision system that tells you what to repeat, revise, stop, or fund.

    The Dashboard Problem Every Creator Eventually Faces

    Maya has just reached 50,000 followers after a Reels post spreads far beyond her usual audience. Instagram reports 180,000 reach, 12,000 profile visits, and a 6.8% engagement rate. She feels confident that the post has changed her business.

    Shopify tells a less dramatic story. There are three orders totaling $214, but none is connected clearly to the Reel. Maya can see that something happened, yet she can't tell whether the purchase came from the video, an older email, a returning customer, or a separate product page. The platform rewarded visibility, while her business needed evidence of influence.

    This disconnect usually appears through familiar symptoms:

    • Spikes never recur. A post gets broad distribution, but the team can't identify the hook, audience, or offer responsible for the result.
    • Audience growth doesn't translate. Follower numbers rise while email sign-ups, booked calls, or product-page visits remain difficult to explain.
    • The content calendar follows applause. The team repeats formats that earn comments or likes, even when other content moves prospects toward a commercial action.

    A centralized dashboard can combine metrics from multiple platforms, but aggregation alone won't solve Maya's problem. A cross-platform total can be misleading because each network applies its own counting rules. As one social media analytics guide warns, adding views across platforms doesn't produce a meaningful single view count.

    Practical rule: A metric earns a place on your dashboard only when it supports a decision.

    The useful shift is from counting impressions to measuring decisions. That means assigning content to a funnel stage, connecting links and events to downstream actions, and checking whether dashboard totals remain close enough to source data to trust. The framework below treats revenue attribution, funnel-stage contribution, and a 5% variance tolerance as operating requirements, not decorative extras.

    What a Social Media Analytics Dashboard Actually Does

    A reporting screen answers, “What happened?” A decision system answers, “What should we do next, and what evidence supports that choice?” A social media analytics dashboard becomes useful when it makes the second question easier to answer.

    At its simplest, the dashboard creates a centralized view of metrics drawn from different networks. That can include reach, impressions, engagement, follower growth, clicks, watch time, and mentions. The value isn't that every number appears together. The value is that the team can compare related activity without repeatedly logging into each platform, while still respecting platform-specific definitions.

    A practical dashboard performs four jobs:

    1. It tracks awareness. Reach and impressions show how widely content was distributed, but they shouldn't be treated as interchangeable.
    2. It measures engagement quality. Saves, shares, meaningful comments, profile visits, and clicks reveal more about intent than a loose pile of reactions.
    3. It maps funnel progression. The dashboard connects content exposure to site sessions, sign-ups, downloads, leads, or other defined actions.
    4. It assigns commercial credit. UTM parameters, pixels, analytics platforms, and CRM records help connect posts or campaigns with conversions and revenue.

    The contrast is easiest to see in two dashboard designs. A vanity view stacks likes, follower count, and impressions in isolated cards. A funnel-aware view places impressions at the top, intent signals such as saves and click-through rate in the middle, and assisted conversions or revenue at the bottom.

    Every card should lead to an action: cut, double down, iterate, or escalate to paid. A useful guide to analytics dashboards for writers is helpful for creators who want to translate performance data into clearer content decisions rather than just produce another report.

    Keep the architecture simple. Start with core KPIs, add the attribution plumbing that gives those KPIs business meaning, then use a rollout checklist to validate definitions, ownership, and source consistency.

    The Core KPIs and What Their Formulas Really Measure

    A dashboard becomes credible when every KPI has a definition, formula, and limitation. The HubSpot reference on social media metrics describes the core logic behind measures such as reach, impressions, engagement rate, click-through rate, follower growth, and conversion rate.

    Visibility metrics

    Reach measures unique people or accounts exposed to content. Impressions measure the total number of displays, including repeat exposure. Reach answers “how many distinct accounts did we reach?” Impressions answer “how often was content displayed?”

    Neither metric proves attention or business value. A person can be counted as reached without remembering the message, and impressions can include repeated displays that don't create new demand. Never add views or reach across platforms as though the totals represent unique people. The counting rules differ by network.

    Interaction and intent metrics

    Engagement rate is commonly calculated as:

    total engagements ÷ reach × 100

    It estimates the proportion of reached accounts that interacted. The hidden assumption is that all engagements carry comparable meaning. A like, save, share, and substantive comment don't necessarily indicate the same level of intent.

    Click-through rate is:

    link clicks ÷ impressions

    It connects exposure with a click action, but only if impressions and clicks use compatible scopes and time periods. Save rate and share rate often provide stronger signals of usefulness or advocacy than likes, although each still needs a defined denominator.

    Video completion rate and average watch time describe how much video people consume. These measures can help diagnose whether the opening earns attention, but platform definitions vary, particularly around what qualifies as a view or completion. Don't compare them without recording each platform's rule.

    Commercial metrics

    Conversion rate measures the proportion of clicks that become a defined action, such as a sign-up, download, lead, or purchase:

    conversions ÷ link clicks

    The formula assumes the click and conversion events are tracked consistently and that the attribution window is appropriate.

    Revenue per mille is:

    revenue ÷ impressions × 1,000

    It translates revenue into an impression-based efficiency measure. It isn't normally visible in native social analytics because revenue usually lives in a store, payment system, analytics property, or CRM.

    KPI Formula Measures Hidden trap
    Reach Unique exposed accounts Distribution breadth Doesn't prove attention or deduplicate across platforms
    Impressions Total content displays Exposure volume Can include repeat displays
    Engagement rate Engagements ÷ reach × 100 Interaction relative to exposure Treats different interactions as equivalent
    Click-through rate Link clicks ÷ impressions Movement from exposure to click Depends on compatible scopes and periods
    Watch time Platform-defined viewing duration Depth of video consumption Definitions differ by network
    Conversion rate Conversions ÷ link clicks Clicks becoming defined actions Fails when events or attribution are incomplete
    Revenue per mille Revenue ÷ impressions × 1,000 Revenue efficiency against exposure Requires external revenue and trustworthy impression data

    For a practical contrast between platform-specific engagement calculations, see this YouTube engagement rate calculator. The important lesson is simple: a formula doesn't remove context. It makes the context explicit.

    Native Analytics Versus Third-Party Aggregators

    Native analytics and third-party dashboards solve different problems. Native tools are closest to the platform's own records, so they're usually the right place to diagnose why a particular post, audience, or video behaved as it did. Aggregators provide the unified view needed for cross-channel reporting, but they introduce a normalization layer that must be inspected.

    Meta, LinkedIn, X, TikTok, and YouTube expose platform-specific information about impressions, engagement, audience behavior, and video retention. Those definitions don't line up automatically. Reach, views, completion, and engagement can follow different eligibility rules, so a native result may be accurate within its own environment while remaining unsuitable for direct comparison with another network.

    Third-party tools such as Sprout Social, Hootsuite, and Looker Studio can pull data through APIs and organize it in one place. That saves reporting effort and makes trends easier to scan, but it doesn't guarantee perfect comparability. API sampling, delayed synchronization, timezone differences, and platform changes can affect the numbers. A dashboard also shouldn't assume that a person active on Instagram and Facebook represents two separate people when the business question concerns audience size.

    Dimension Native Analytics Third-Party Aggregator
    Primary use Diagnose one platform Review cross-channel trends
    Definitions Native to the network Mapped or normalized
    Detail Strong post and audience detail Strong portfolio and campaign view
    Main risk Siloed reporting Sampling, sync, and mapping errors
    Best decision Improve a primary channel Compare channels and summarize performance

    Creators working heavily on LinkedIn may benefit from reviewing a practical selection of LinkedIn analytics tools, especially when native reporting needs to sit beside broader campaign data. For video-focused teams, YouTube growth tools can complement native YouTube diagnosis without pretending that every platform metric means the same thing.

    Use a clear decision rule. Keep native analytics as the diagnostic authority for the primary channel. Use a third-party aggregator for executive trends, campaign comparisons, and operational visibility. Before reporting, write down the definition each tool uses.

    Building the Attribution Layer Behind the Dashboard

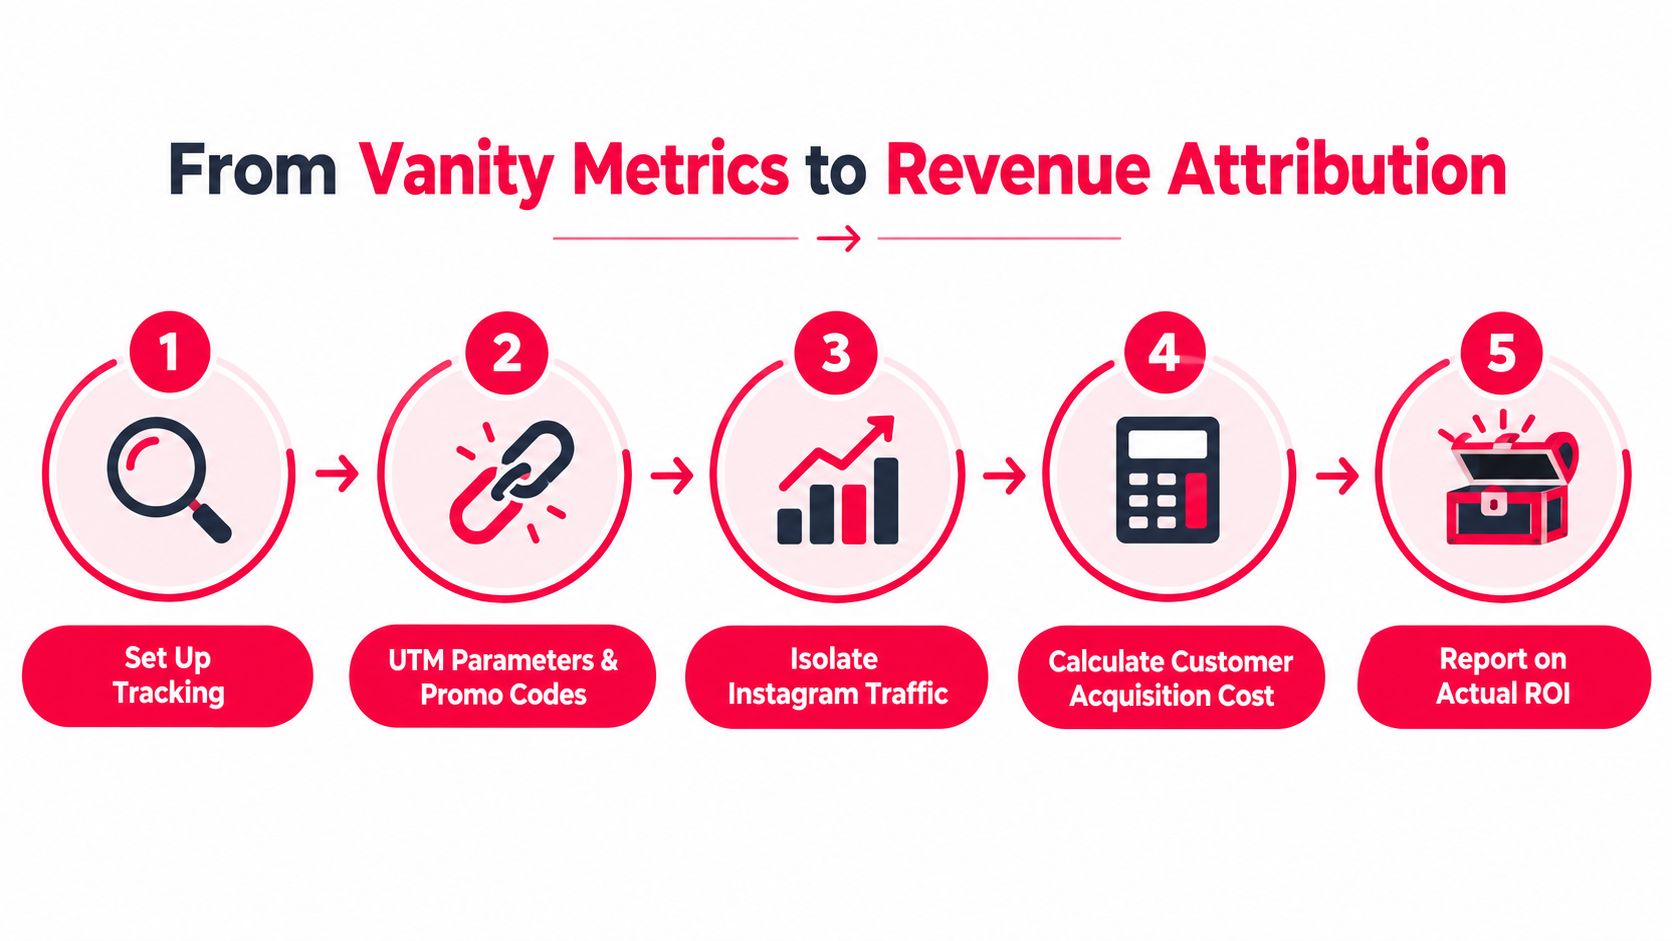
    A creator can see traffic in a dashboard and still miss the post that caused it. The missing layer is attribution, which connects a content action to a site event, customer record, and eventually revenue.

    Standardize the link

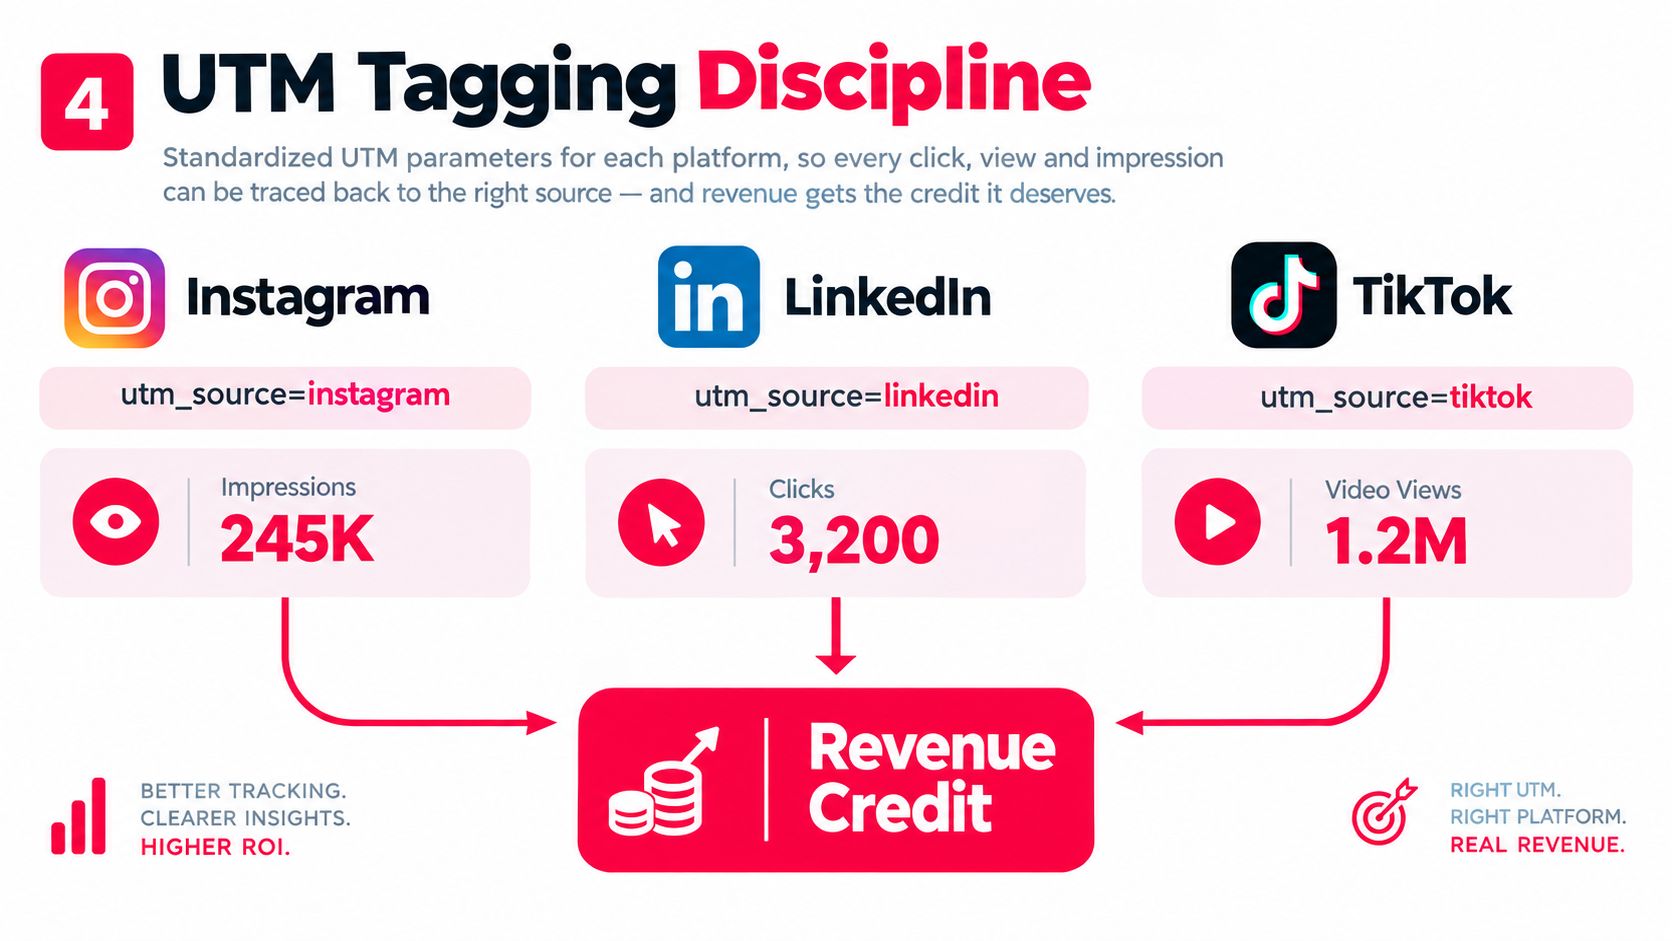
    Create one naming convention for every outbound link. Use values such as utm_source=instagram, utm_source=linkedin, or utm_source=tiktok; set utm_medium to social-organic or social-paid; and assign utm_campaign to a content pillar, launch, or offer window.

    Consistency matters more than the exact labels. “IG,” “Instagram,” and a blank source become separate reporting values even when they describe the same channel. Bitly or Pretty Links can shorten URLs and carry click identifiers, as long as the redirect preserves the UTM parameters.

    A diagram demonstrating UTM tagging for Instagram, LinkedIn, and TikTok to track social media marketing revenue attribution.

    Capture the event

    Set up the measurement layer for each platform and property involved. Depending on the setup, that may include Meta Pixel, LinkedIn Insight Tag, TikTok Pixel, or server-side Google Tag Manager. Privacy restrictions can weaken browser-only tracking, so document which events are observed directly and which rely on modeled or server-side signals.

    The dashboard should make this path visible:

    post or video → tagged click → site session → defined event → CRM record or order

    For creators optimizing their YouTube workflow, TubeBuddy for YouTube can help manage tags and track performance alongside the attribution setup.

    Preserve the source in the CRM

    When someone submits a form, HubSpot or Salesforce should capture the UTM values and retain first-touch and last-touch fields on the contact record. Those fields support a multi-touch model, so the team can recognize earlier contributions instead of assigning every conversion to the final click.

    The content marketing dashboard guidance from Improvado recommends UTM-tracked clicks, weekly validation against source platforms, and explicit data lineage. It also identifies timezone mismatches, bot filtering, GA4 sampling, and CRM sync delays as common causes of disagreement, with under 5% variance between dashboard and source totals suggested for core metrics such as sessions, conversions, and revenue.

    Define attribution windows as well. Use a short click-through window for low-consideration captures and a longer engagement window for higher-value purchases, then document those rules rather than treating them as universal. Review tags and event flows weekly. A broken redirect discovered after a campaign can invalidate the conclusions drawn from the dashboard.

    Mapping Content to Conversions Across the Funnel

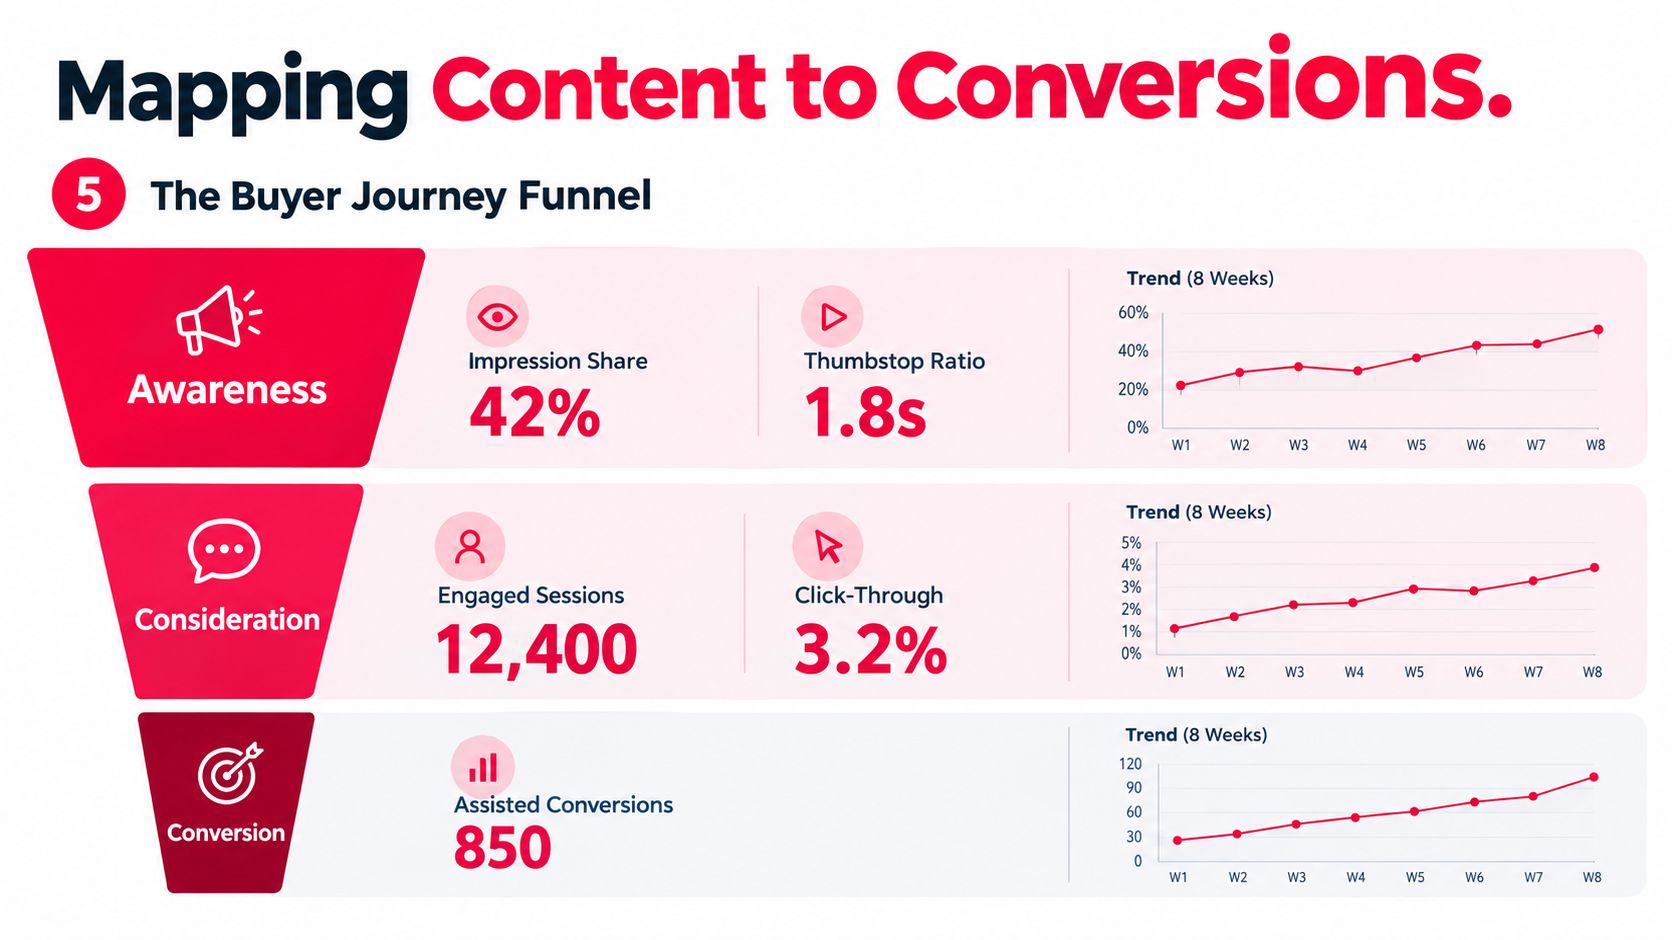
    A post can contribute to revenue without closing the sale immediately. The dashboard should therefore show progression, not just the final transaction.

    At the awareness stage, review impressions, reach, and early attention signals against the platform's own baseline. The question is whether the creative earns distribution and initial attention with the intended audience. A broad impression count without audience relevance doesn't establish demand.

    At consideration, examine saves, shares, comment quality, profile visits, and link-out CTR. Pair those signals with events such as email opt-ins, gated downloads, or add-to-cart actions. A post that earns fewer visible reactions but generates qualified site activity may deserve more attention than a highly shared post that produces no downstream movement.

    A digital marketing funnel infographic showing metrics for Awareness, Consideration, and Conversion stages over eight weeks.

    At the decision stage, connect assisted conversions, branded search behavior, time to purchase, and closed revenue. Social content may introduce the offer while another channel receives the final click. That doesn't make the original content irrelevant, but the dashboard should label it as an assist rather than claiming last-click credit.

    Each stage needs its own audience definition, event or UTM variant, and acceptable latency. Keep those definitions visible beside the widget so a viewer knows what the number represents.

    Buying journeys are often asynchronous. Someone may watch a TikTok video, search the brand later, and purchase through a direct visit. A short reporting window can make the video look ineffective. Review longer lookback windows, such as 30, 60, and 90 days, when the offer involves meaningful consideration, and compare the results with a shorter window for immediate-response campaigns.

    Why Fewer KPIs Beat More in a Real Dashboard

    A crowded dashboard can hide poor accountability. When every metric receives equal visual weight, no one knows which result should change the next piece of content.

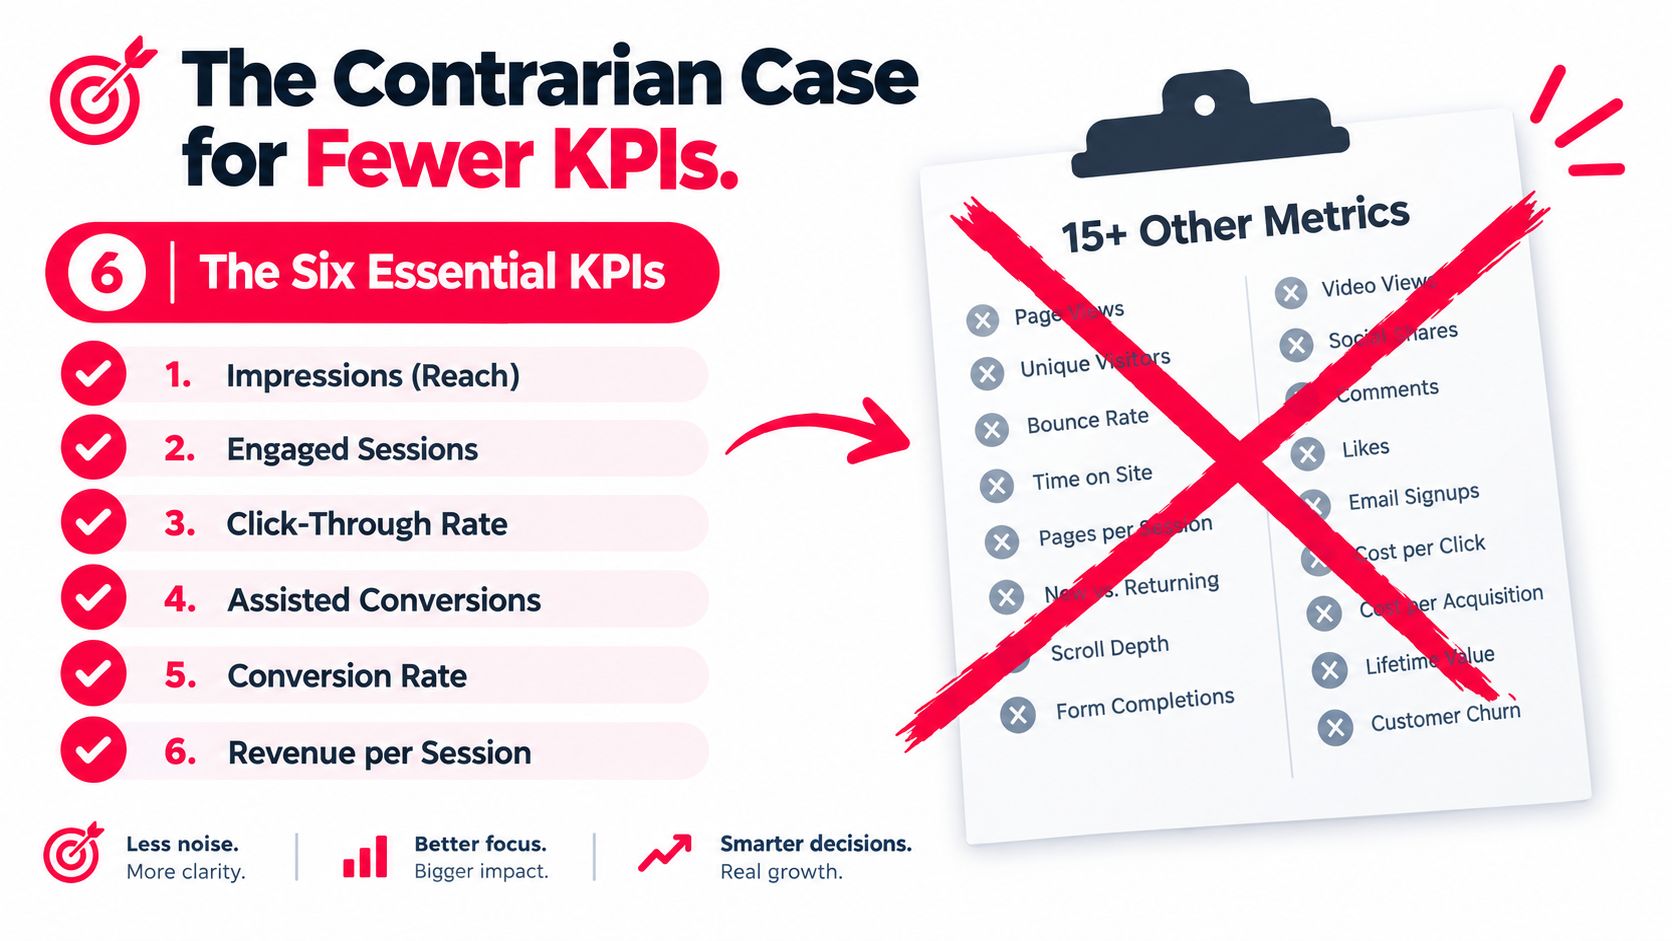
    A working dashboard can begin with six decision-oriented measures:

    • Impressions and reach: Confirm whether distribution is expanding toward the intended audience.
    • Engaged sessions: Show whether social visitors do more than arrive and leave.
    • Click-through rate: Identify content that creates movement from platform to owned property.
    • Assisted conversions: Preserve contribution from content that influences a later conversion.
    • Conversion rate: Test whether the destination and offer convert the traffic received.
    • Revenue per session or post: Connect activity to commercial value when revenue data is available.

    The exact set can change with the business model. A creator selling directly may prioritize revenue per post, while a coach collecting applications may emphasize booked calls. The common requirement is that every KPI must survive a weekly decision test.

    Keep, drop, validate

    Keep a metric when it can trigger an action within the next review cycle. Drop a metric that exists mainly to reassure the team or decorate a client report. Validate any cross-platform number against its source and investigate differences instead of smoothing them away.

    The 5% variance rule belongs here because trust is operational. The Improvado dashboard guidance recommends keeping variance under 5% for core totals such as sessions, conversions, and revenue, while the cross-platform social media marketing analysis from Socialinsider emphasizes platform-specific baselines for engagement, reach, follower growth, and posting frequency.

    A chart showing six essential KPIs contrasted against fifteen non-essential metrics on a clipboard.

    If a KPI can't be tied to a decision made this week, it doesn't belong on the main screen.

    A Practical Rollout Checklist for Your First Dashboard

    Build the dashboard in an order that protects data quality. A polished interface can't repair missing tags, ambiguous definitions, or an owner who doesn't know how a metric was collected.

    Start with lineage

    For every KPI, record three things:

    • Source: Native platform, analytics property, CRM, store, or payment system.
    • Definition: The exact formula and inclusion rules.
    • Owner: The person responsible for checking the number and acting on it.

    Then compare native totals with the third-party dashboard. Treat a variance above 5% as a tracking issue to investigate, not as a harmless difference. Check date ranges, timezone settings, filters, bot treatment, API delays, and event deduplication before changing the definition.

    Build the operating layer

    Apply the UTM naming convention to every outbound campaign. Confirm that redirects preserve parameters, landing pages receive them, forms store them, and CRM records pass them into reporting. Run a test click and conversion before launching content.

    Review the dashboard weekly. Ask which content created meaningful traffic, which posts assisted conversions, where tracking broke, and what action follows from the result.

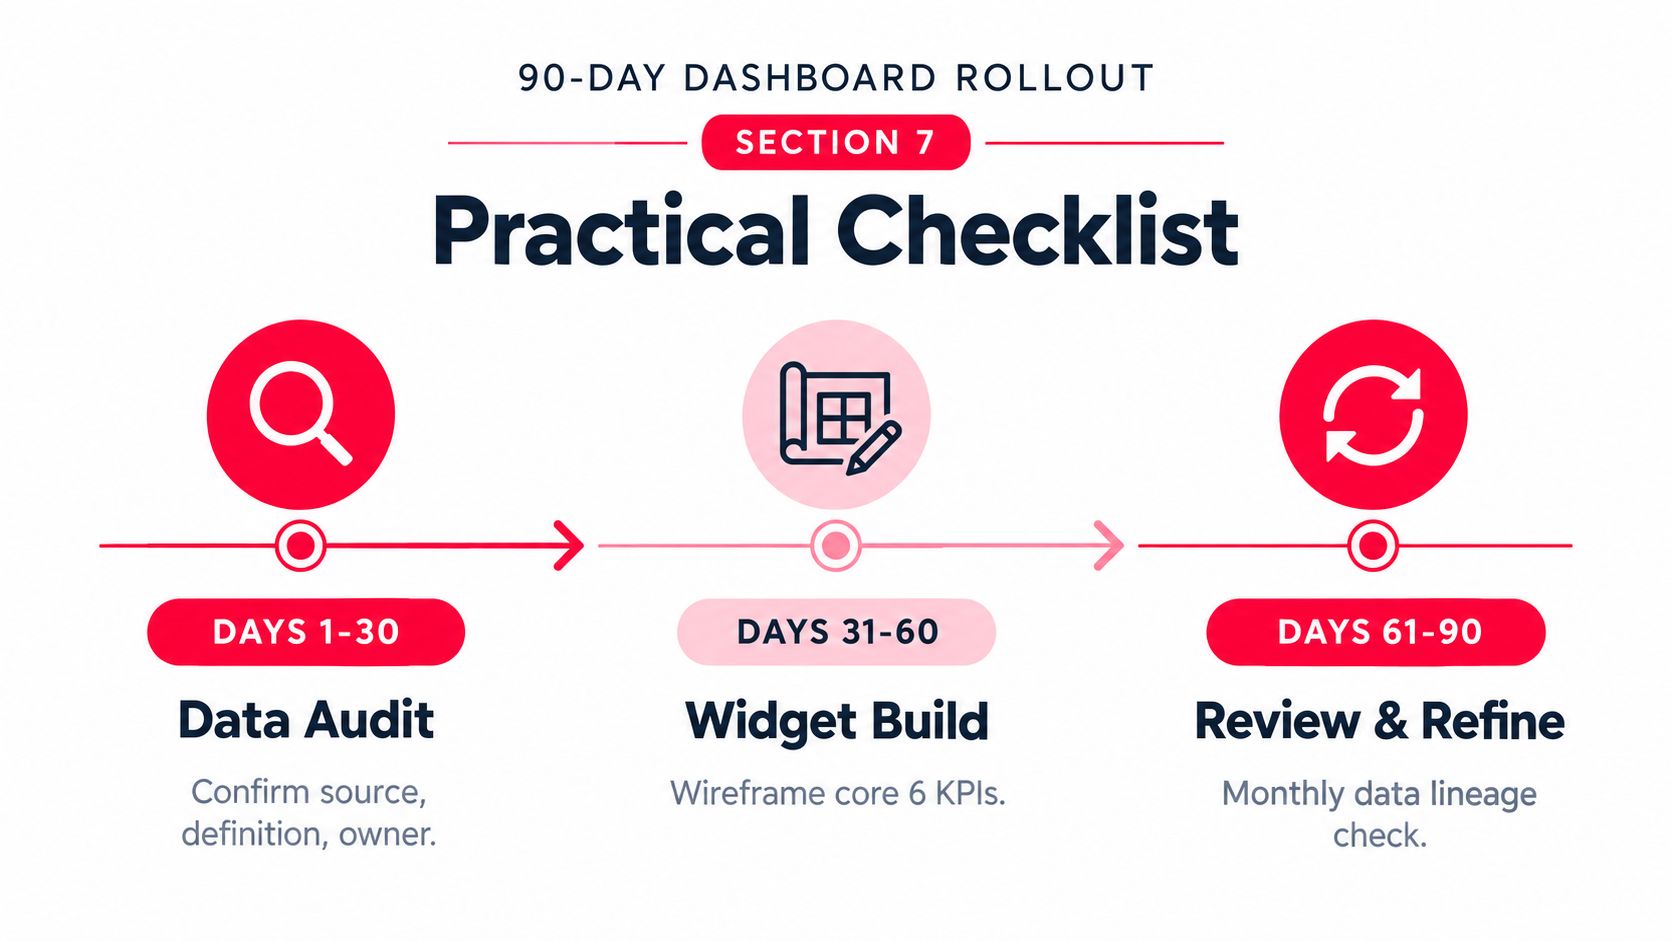
    Use the first 90 days deliberately

    During weeks one through two, validate metric definitions, source connections, ownership, and time settings. During weeks three through six, refine attribution, test event persistence, and resolve source discrepancies. During weeks seven through twelve, retire KPIs that haven't supported decisions and promote signals that consistently guide content or budget choices.

    A 90-day dashboard rollout plan showing three phases: data audit, widget build, and review and refine.

    ViewsMax is one option for creators who want to plan and publish across channels while monitoring clicks, calls booked, and attributed revenue in one place. Visit ViewsMax to connect your content workflow with the attribution signals that show which posts are doing the selling.

  • How YouTube Video Rankings Actually Work in 2026

    How YouTube Video Rankings Actually Work in 2026

    Pinkfong's “Baby Shark Dance” has about 17.3 billion views, while the next two videos in YouTube's all-time ranking, CoComelon's “Wheels on the Bus” and Luis Fonsi's “Despacito,” sit at roughly 9.0 billion each, according to TubeAnalytics' ranking of the most-viewed YouTube videos. The gap is measured in billions, not millions.

    That disparity changes how creators should think about YouTube video rankings. Ranking isn't a contest for the highest view count, and YouTube doesn't choose recommendations by sorting every upload from most viewed to least viewed. Its system first finds plausible candidates, then evaluates which candidate is most likely to create a satisfying viewing session for a particular person.

    For revenue-focused creators, that distinction matters. A ranking win that produces views but no qualified clicks, leads, or sales may be less valuable than a smaller discovery win that reaches the right audience. The practical question isn't only, “How do I rank higher?” It's, “Which ranking signals create the kind of attention my business can convert?”

    The Scale of YouTube Rankings Today

    The upper end of YouTube's ranking system is almost impossible to comprehend through ordinary creator benchmarks. “Baby Shark Dance” leads the all-time list with about 17.3 billion views, while “Wheels on the Bus” and “Despacito” are each around 9.0 billion views. The leader therefore has nearly twice the views of either title below it, a sharp example of how concentrated the top of the platform can become. (TubeAnalytics)

    That concentration didn't appear overnight. The first video to reach 1 billion views was Psy's “Gangnam Style” in December 2012. By January 13, 2022, “Baby Shark” had become the first video to reach 10 billion views, and independent 2026 rankings report that more than 30 videos had crossed 4 billion views, with 14 surpassing 5 billion. (Likes.io's historical summary)

    Why the top of the list looks different

    The historical pattern also reveals a shift in what sustains attention. Since Lady Gaga's “Bad Romance” reached the top of YouTube's all-time most-viewed ranking in April 2010, every later video to claim that position has been a music video. Children's content now occupies several leading positions, suggesting that repeatable, family-friendly formats can generate viewing across years rather than depending on a short viral burst. (Likes.io)

    That doesn't mean a new educational channel must compete with “Baby Shark.” All-time rankings measure cumulative reach, while search and recommendation systems evaluate a video in the context of a viewer, a topic, and competing candidates. A specialist tutorial can rank for a valuable query without approaching the lifetime scale of global music or children's content.

    The useful comparison isn't your video against the biggest video on YouTube. It's your video against the alternatives shown to the same viewer.

    A safer way to read ranking data

    The table below uses only the verified all-time ranking facts available here. It doesn't claim an average for ordinary channels or a percentage share of platform views, because those figures aren't established in the supplied evidence.

    Channel Tier Avg. Lifetime Views % of Total Platform Views
    All-time leader, “Baby Shark Dance” About 17.3 billion Not established
    Next two all-time titles Around 9.0 billion each Not established
    Broader top tier More than 30 videos above 4 billion views Not established
    Typical new or niche upload Varies by channel and topic Not established

    The scale can feel discouraging, but it also clarifies the opportunity. YouTube's recommendation model doesn't need every creator to become a global hit. It needs enough evidence to decide that a particular video is relevant and satisfying for a particular audience. Creators who understand that decision process can replace superstition with measurable experiments.

    How the YouTube Recommendation Engine Actually Works

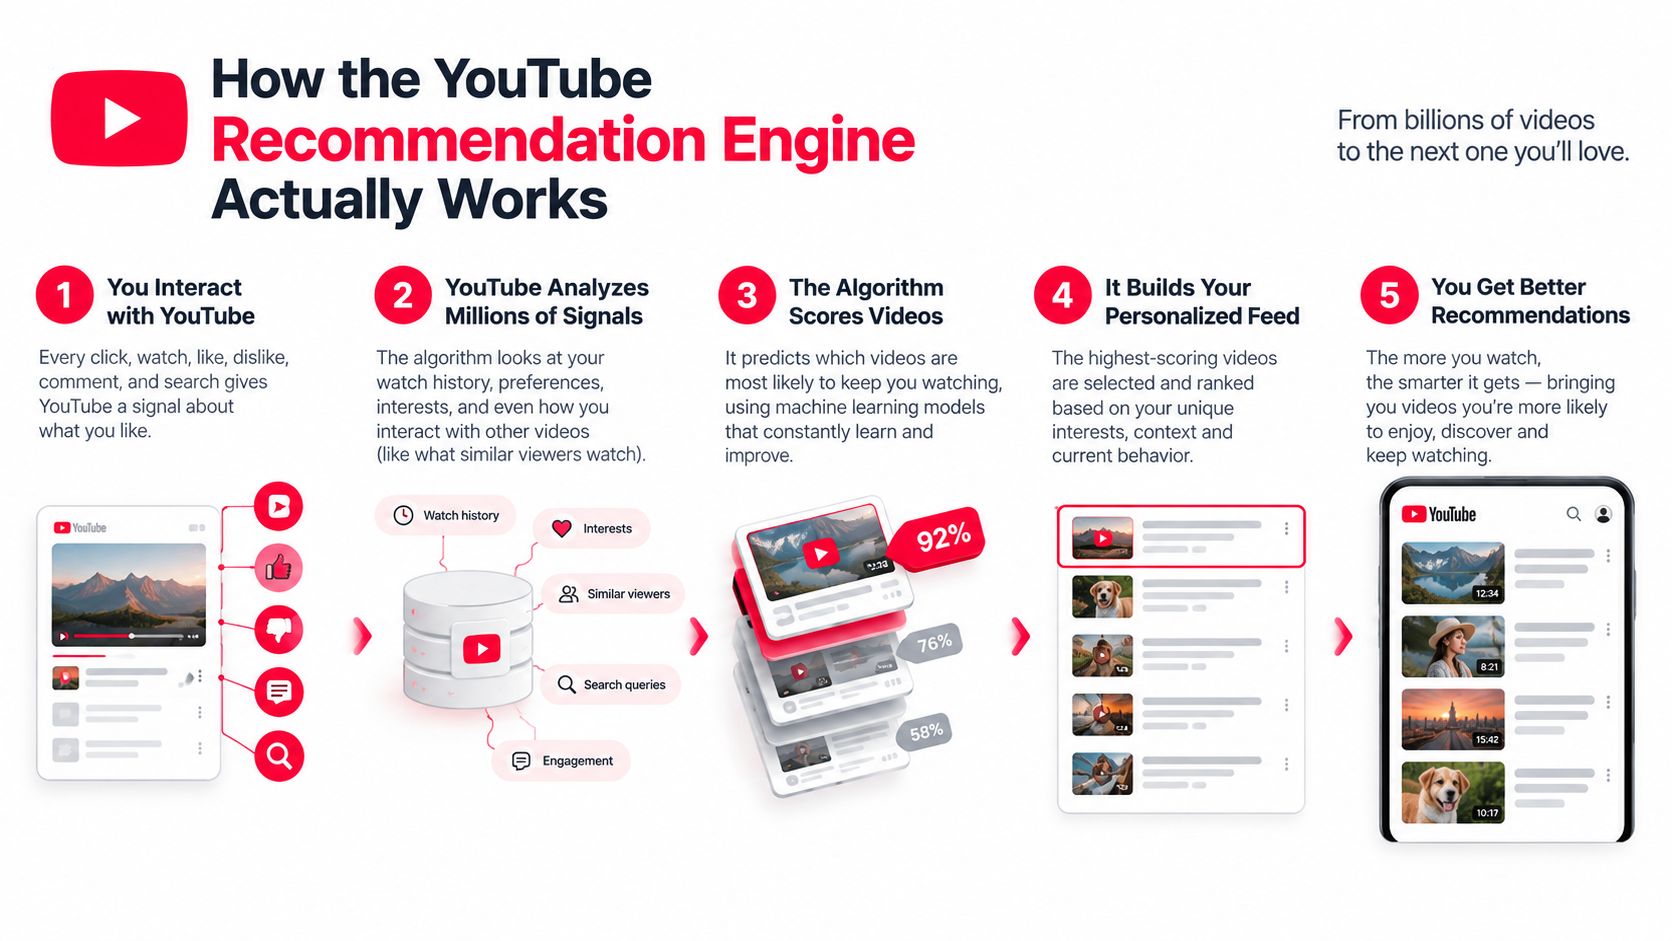
    YouTube's recommendation architecture is easier to understand as a two-stage funnel than as a single mysterious algorithm. The first stage generates a manageable set of possible videos. The second stage ranks those candidates using detailed information about the viewer and the videos. This structure is described in Google's technical paper on deep neural networks for YouTube recommendations.

    Think of a librarian serving a reader. The librarian doesn't evaluate every book in the building in the same depth. First, the librarian pulls a smaller shelf of books that match the reader's interests. Then the librarian studies that smaller group and chooses which books to place directly in front of the reader.

    Stage one, candidate generation

    The candidate-generation network narrows a very large video corpus using signals connected to user context. Those signals can include a viewer's watch history, previous interactions, and the relationship between videos watched by similar audiences. The output is not the final recommendation. It's a pool of plausible options.

    For a creator, this stage answers a basic question: Can YouTube identify the people and topics your video might fit? Titles, descriptions, spoken content, thumbnails, and channel context help provide that fit. A video with unclear subject matter may struggle to enter the right candidate pool, even if the production quality is strong.

    Stage two, ranking

    The ranking network then scores each candidate with a richer feature set describing the video and the viewer's current context. Google's research states that the system is optimized around predicted watch time, which means a click matters because it may lead to a longer viewing session, not because the click itself is the final objective. A compelling thumbnail that attracts the wrong audience can therefore create a weak downstream result.

    A video can pass candidate generation but lose in the ranking stage. It may be relevant enough to appear among possible recommendations, yet fail to win the final placement because viewers leave quickly or respond poorly. Conversely, a well-satisfied audience can help a clearly positioned video compete for additional exposure among related viewers.

    A five-step infographic explaining how the YouTube recommendation engine algorithm analyzes user behavior to suggest personalized videos.

    This is why metadata and audience response shouldn't be treated as competing strategies. Metadata helps YouTube understand where to test a video. Viewer behavior helps determine whether the test should expand. Creators looking for a broader overview of how platform changes affect distribution can also review this YouTube algorithm change guide.

    The same distinction applies to monetization. Once a video earns discovery, the creator still needs a path from viewing to action. For a practical explanation of how paid and organic discovery can support that path, see Wojo Media's guide to turn browsing intent into conversions.

    The Ranking Signals That Move the Needle

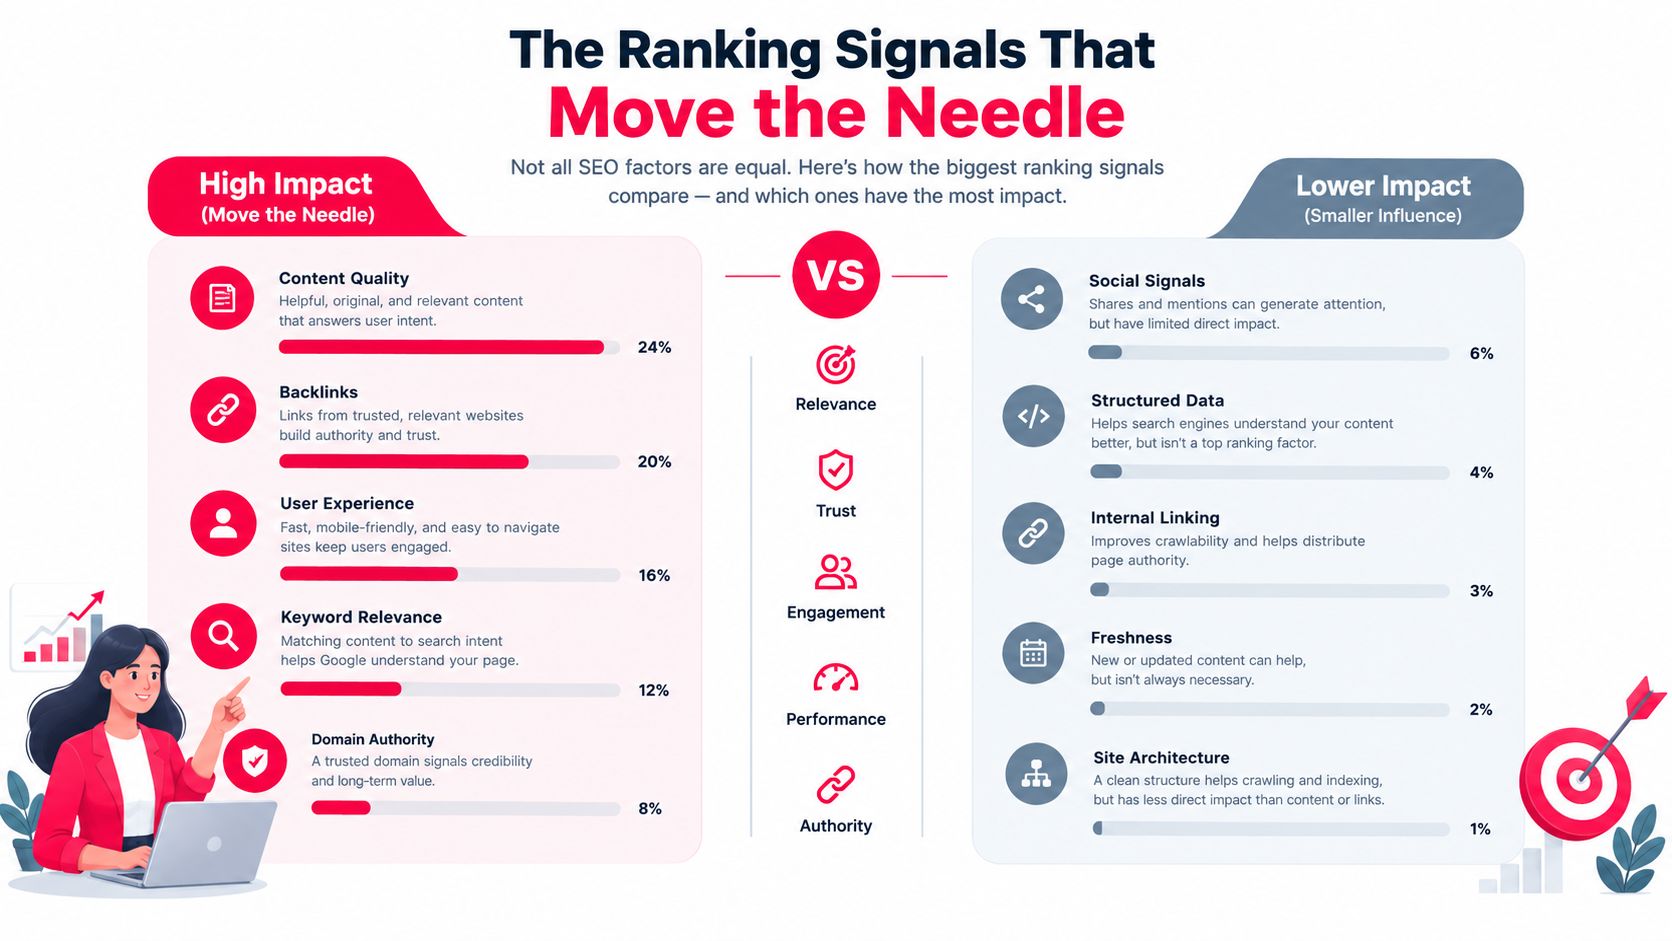
    The most useful way to read YouTube ranking signals is as a sequence. Relevance gets a video considered. The click creates an opportunity. Watch behavior and satisfaction determine whether that opportunity becomes durable distribution. No single dashboard number explains the entire process.

    Click appeal starts the test

    A title and thumbnail create the first decision. If the packaging doesn't communicate a clear reason to watch, the video may receive fewer opportunities to prove its value. But a high click-through rate isn't enough by itself. Google's description of the recommendation system makes clear that the deeper ranking stage is concerned with predicted viewing time and user context, not clicks in isolation. (Google Research)

    The practical implication is simple. Your thumbnail should make a promise that the opening delivers. A dramatic image paired with a vague or exaggerated title can generate curiosity, but if viewers leave after discovering the mismatch, the initial click won't rescue the video.

    Retention gives the click meaning

    Average view duration measures how long viewers watch. Percentage viewed measures how much of the video they consume relative to its length. A longer upload can produce more minutes per viewer, but only if the structure earns those minutes. Padding a script creates more opportunities for viewers to leave.

    The supplied SEO analysis found that videos in the top positions averaged 2.65% engagement, compared with a 0.09% platform average, and that top-position videos averaged 358,000 views, versus 303,000 for second position and 292,000 for third. The same analysis found that 8 to 9 minute videos appeared in top positions most frequently. These figures are correlations, not guaranteed targets for every niche, but they show why format, engagement, and viewing behavior should be analyzed together. (Search Engine Journal)

    Satisfaction adds the quality check

    Satisfaction is broader than watch time. It includes whether people respond positively, continue watching related content, return to the channel, or signal that a recommendation wasn't useful. Recent industry discussion has focused on viewer satisfaction as a dominant consideration, but the evidence is contextual and mixed across formats, regions, and discovery surfaces. (OutlierKit)

    A revenue-focused creator should therefore ask two questions after a ranking lift:

    1. Did viewers stay long enough to demonstrate value?
    2. Did the audience take a commercially useful next step?

    Likes and comments can support the first answer, but they aren't revenue proof. A video can attract substantial discussion while reaching people who have no relationship to the creator's offer. Conversion tracking must sit alongside native engagement data.

    An infographic showing the comparative ranking impact of various SEO factors like content quality and backlinks.

    Older assumption Better operating rule
    Maximize raw watch time Earn sustained viewing from the right audience
    Make every video longer Choose a length the topic can support without filler
    Optimize for clicks alone Align the title and thumbnail with the delivered experience
    Treat engagement as the outcome Measure engagement alongside qualified actions
    Read ranking as a vanity metric Connect ranking exposure to downstream business results

    The signal to improve first depends on the failure point. Low impressions with strong retention may indicate a relevance or packaging problem. Strong impressions with weak retention point toward a promise, pacing, or audience-fit issue. Good viewing behavior with no business action suggests the conversion path needs work.

    Optimization Tactics You Can Apply This Week

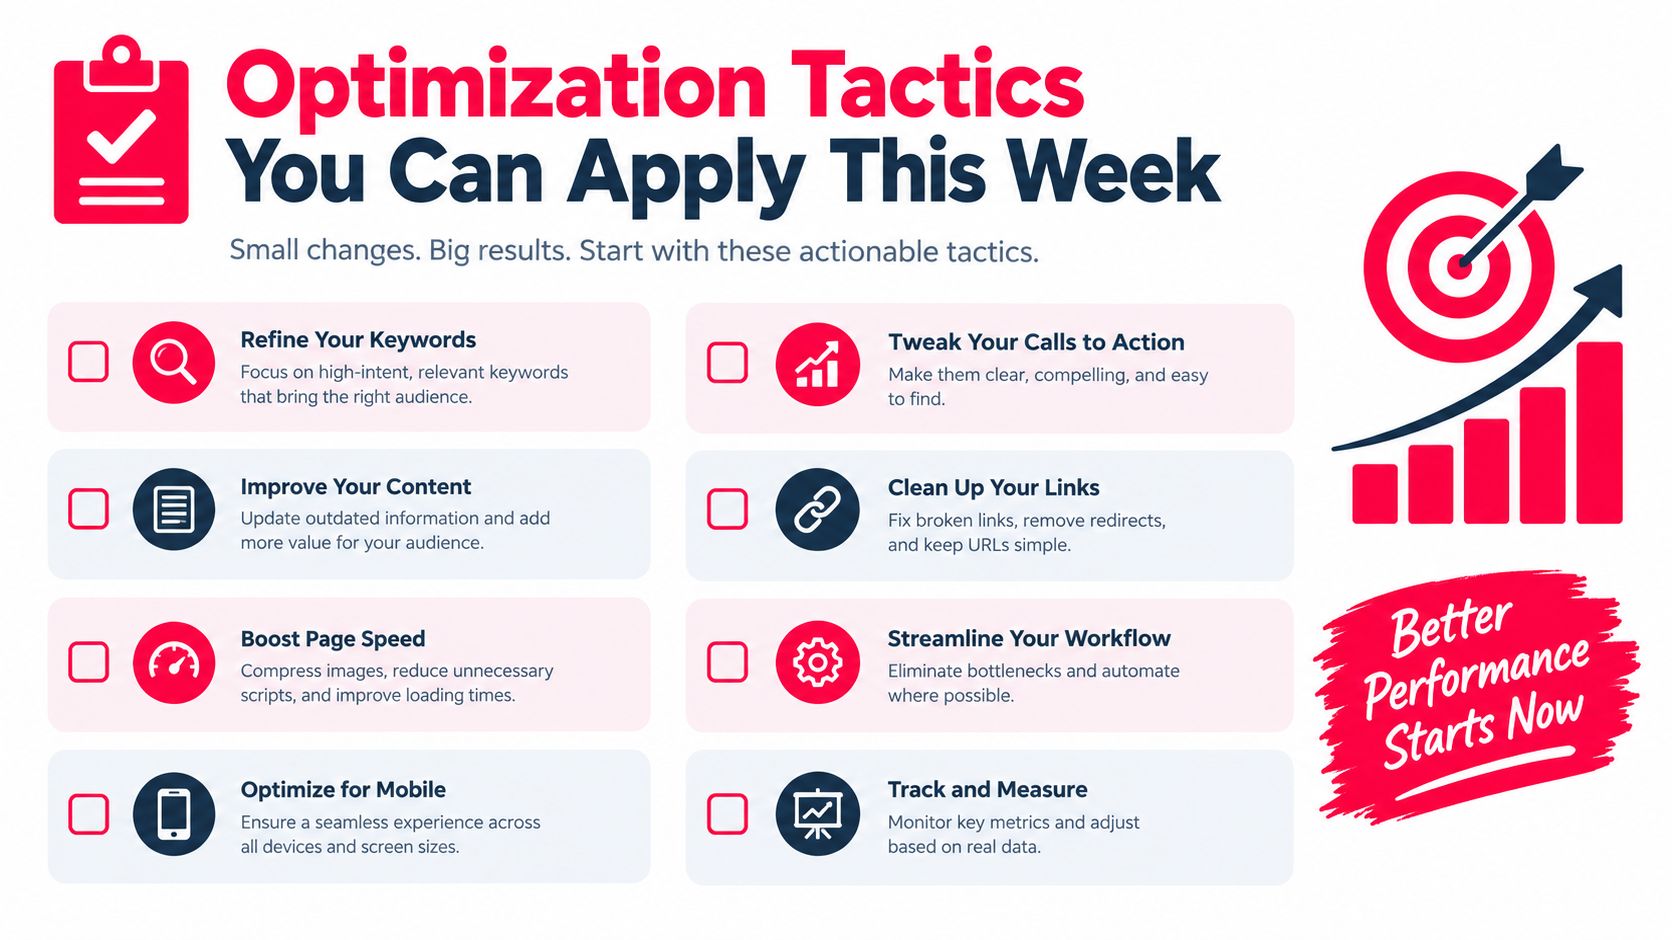
    Optimization works best when each change has a specific job. Titles and descriptions clarify relevance. Thumbnails earn the click. The opening protects the promise. The middle gives viewers a reason to continue. You don't need to redesign the whole channel before publishing the next useful test.

    Start with the promise

    Write the title before finalizing the script. Lead with the viewer's intent, then add a specific outcome or tension. “YouTube Video Rankings Explained for Revenue-Focused Creators” tells the audience what the video is about, while “Why Your Ranking Win Isn't Producing Sales” creates a business consequence.

    Use the description to reinforce that promise. Put a concise explanation in the opening lines, then add chapters with descriptive labels that reflect the questions viewers care about. Tags can act as a confirmation layer for topic context, but they shouldn't carry the discovery strategy on their own.

    For a broader set of practical channel adjustments, use these YouTube SEO optimization tips as a planning reference.

    Design the click before production ends

    A thumbnail should remain legible when it's small. Use strong contrast, a clear focal point, and only the visual information needed to make the idea understandable. If text appears, keep it short enough to read without effort.

    Test the title and thumbnail as a pair. Ask a colleague who hasn't seen the script what they expect from the video after seeing the package. If their answer doesn't match the actual lesson, the packaging is creating the wrong candidate audience.

    A checklist infographic titled Optimization Tactics You Can Apply This Week featuring eight actionable website improvement strategies.

    Treat the opening as a contract

    The first moments should answer three questions:

    • What problem will this solve? State the outcome in plain language.
    • Why should the viewer trust the video? Establish the relevant evidence or perspective quickly.
    • What will keep the viewer watching? Tease the most useful step without delaying the first payoff.

    A practical script pattern is: “If your videos rank but don't generate customers, this tutorial will show you where the funnel breaks. We'll start with the ranking signal, then connect it to the click and sale you can track. By the end, you'll have a review process for deciding which videos deserve more distribution.”

    Cut logos, long greetings, and background information that doesn't serve that promise. The opening should feel like the video has already begun, because it has.

    Protect the middle

    Retention often weakens when the presenter repeats a point or changes topics without a visible transition. Use an open loop, a visual reset, or a chapter pivot to give the viewer a reason to stay oriented.

    A screen recording can replace a static talking-head explanation. A simple diagram can clarify the relationship between impressions, viewing, and conversion. End each major idea with a clear next step rather than a generic transition. These edits improve the viewing experience without forcing a longer runtime.

    Native Analytics Compared With ViewsMax Attribution

    YouTube Studio and attribution software answer different questions. Studio explains what happened inside YouTube. Attribution explains which content interaction contributed to action outside YouTube. Treating one tool as a replacement for the other leaves a blind spot.

    YouTube Studio is the right place to evaluate impressions, click-through rate, average view duration, audience retention, and traffic sources. It helps a creator decide whether the title needs work, whether the opening loses viewers, and whether a video is reaching audiences through search, browse, suggested content, or external referrals.

    It doesn't, by itself, connect every viewer behavior to a completed external outcome. A creator may see that a video received more impressions and watch time, but still be unable to identify which video drove a consultation request, affiliate click, course purchase, or sponsor-linked action without a separate tracking layer.

    What each tool can reveal

    ViewsMax can sit on top of the content workflow by using trackable links for offers and connecting clicks, leads, and sales back to the content source. That makes it useful when the decision isn't only whether a video performed well, but whether the video helped produce a business result. ViewsMax is one option for creators who need planning, publishing coordination, and content-level attribution in the same operating process.

    Capability YouTube Studio ViewsMax Attribution
    Impressions and click-through rate Reports in-platform exposure and click behavior Uses content and link activity to add downstream context
    Watch time and retention Shows how viewers behave during the video Helps connect content interactions with tracked outcomes
    Traffic sources Breaks down where YouTube views came from Attributes tracked clicks, leads, and sales to content or campaigns
    External ad-spend connection Limited for full revenue attribution Supports campaign-level attribution when tracking is configured
    Sponsor or offer reporting Shows audience performance inside YouTube Helps organize evidence of actions tied to a creator or campaign
    Revenue visibility Not a complete external sales ledger Designed to show attributed business outcomes beside content performance

    Use Studio for in-platform creative decisions. Use attribution when you need to defend a budget, compare offers, or understand whether a ranking improvement brought buyers rather than only viewers. The two datasets become more useful when they're read together, especially alongside YouTube view statistics that help establish the reach and behavior context for each upload.

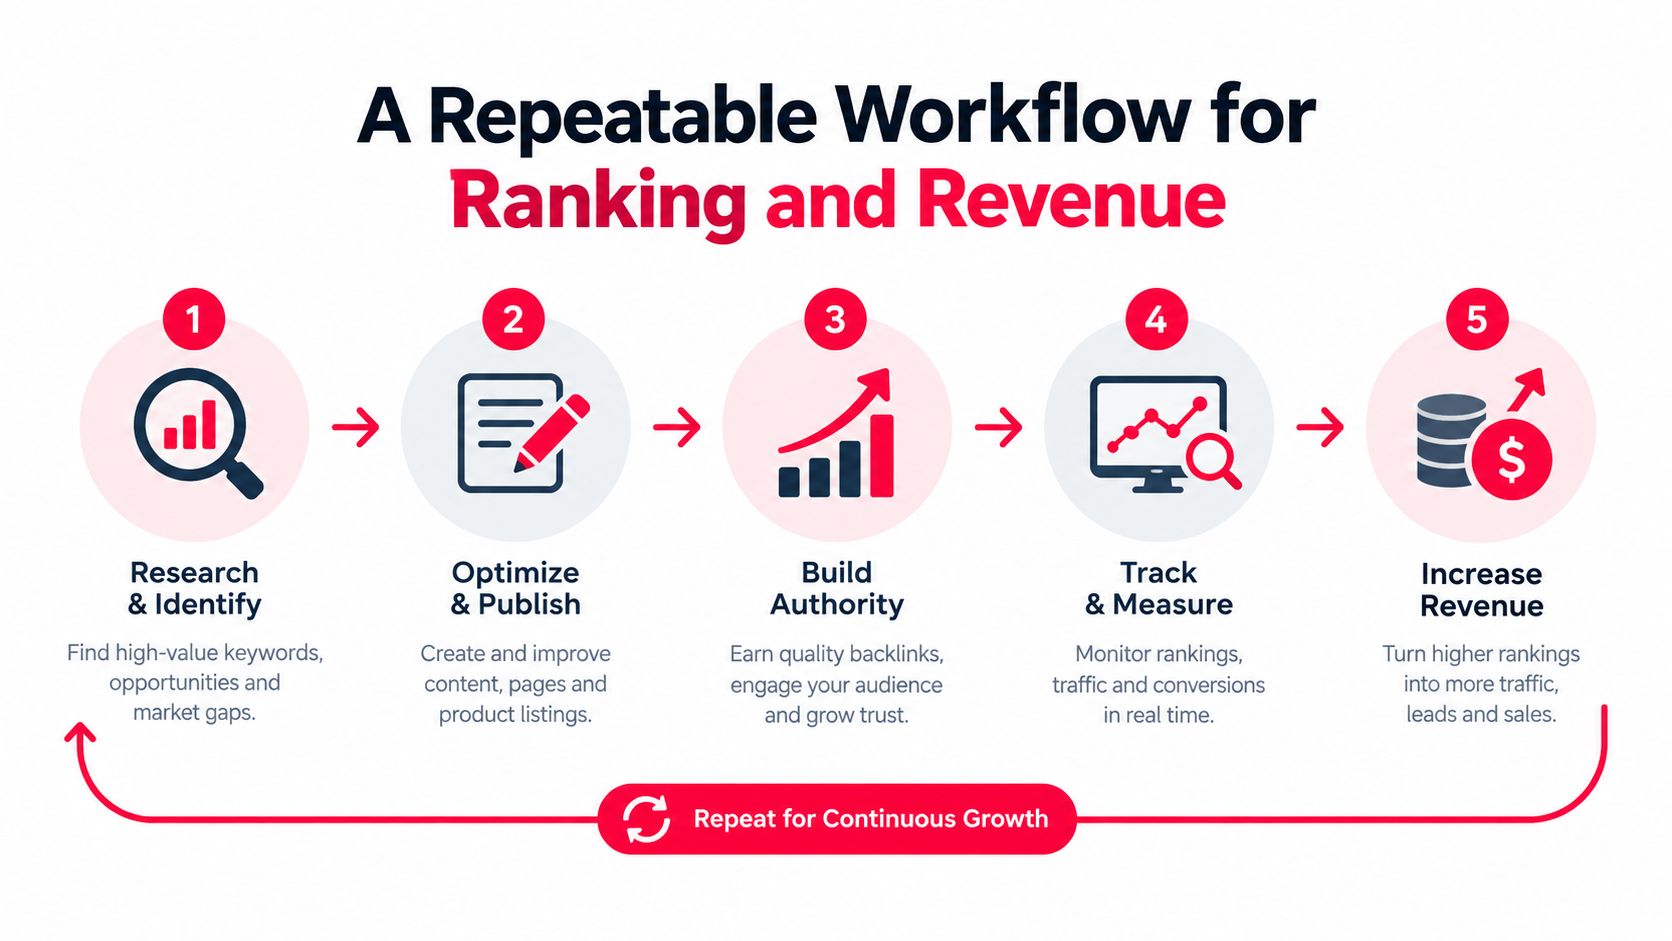
    A Repeatable Workflow for Ranking and Revenue

    A useful workflow begins before the camera turns on and ends after the revenue review. The creator's job is to maintain the loop, not to treat publishing as a sequence of isolated bets.

    Research with a commercial question

    Set aside a recurring research block to examine the language viewers use, the topics competitors cover, and the promises their thumbnails make. Shortlist ideas that match both audience intent and your offer. A video can be relevant to your niche yet commercially disconnected from what you sell, so label each idea with its likely next action before writing the script.

    For each candidate, record:

    • Viewer problem: What does the audience want to understand or accomplish?
    • Ranking surface: Is the idea primarily suited to search, suggested content, or both?
    • Business path: Which tracked page, offer, or follow-up video should receive interested viewers?
    • Evidence to collect: Which Studio and attribution metrics will determine whether the idea worked?

    Prepare the full package

    Before publishing, finalize the title, thumbnail, opening promise, description, chapters, and end-screen destination as one system. The end screen shouldn't be an afterthought. It should continue the viewer journey established by the topic.

    Make sure the external destination matches the video's promise. If the video teaches a process, the linked offer should help the viewer complete or extend that process. A mismatch can preserve views while weakening trust and conversion quality.

    A diagram illustrating a five-step repeatable SEO workflow for improving search rankings and business revenue.

    Review the launch as a diagnosis

    Early performance should guide investigation, not trigger random changes. If impressions are available but clicks lag, test the packaging. If clicks arrive but viewers leave quickly, inspect the opening and the promise match. If viewing is healthy but external action is weak, review the call to action and destination rather than rewriting the thumbnail.

    Record every change. Without a change log, you can't tell whether a result came from a new title, a different thumbnail, a distribution push, or normal variation.

    Close the loop weekly

    At the weekly review, compare ranking movement with attributed clicks, leads, and sales. A video that ranks well but attracts unqualified traffic may need a sharper audience promise. A modestly ranked video that repeatedly sends high-intent visitors may deserve more internal linking, paid support, or a sequel.

    That's the core discipline. Optimize for the business outcome that ranking is supposed to create, not for the ranking screenshot itself.

    Common Myths About the YouTube Algorithm

    Myth one, new creators are automatically buried

    New channels don't need an existing all-time audience to become candidates for discovery. The recommendation system's candidate-generation stage evaluates whether a video fits a viewer context, then the ranking stage evaluates how that candidate performs. That doesn't guarantee broad distribution, but it does mean a creator can compete through relevance and viewer response rather than relying only on historical fame. (Google Research)

    Corrected rule: Make the topic legible and the promise specific enough for YouTube to test the video with a plausible audience.

    Myth two, longer videos always rank higher

    Length creates no automatic ranking advantage. Google's model focuses on predicted viewing time, while current research and industry analysis connect ranking with engagement, format alignment, and audience behavior. A concise tutorial that satisfies its audience can outperform a longer upload that delays the answer.

    The supplied ranking analysis found that 8 to 9 minute videos appeared in top positions most frequently, but that observation isn't a universal runtime prescription. (Search Engine Journal)

    Corrected rule: Choose the shortest structure that can deliver the promised outcome clearly, then use retention data to remove sections that don't earn their place.

    Myth three, publishing more often guarantees growth

    A faster schedule can produce more opportunities, but frequency doesn't compensate for weak topic fit, unclear packaging, or poor satisfaction. A creator who publishes repeatedly without reviewing retention and conversion data may repeat the same failure at greater speed.

    There's also no reliable basis in the supplied evidence for claiming that a specific upload cadence, live-stream schedule, or posting volume guarantees ranking performance. Treat cadence as a production constraint, not as a magic signal.

    Corrected rule: Publish at a pace that lets you research the topic, build a credible promise, review viewer behavior, and connect the result to the next commercial decision.

    Turning Rankings Into Real Business Results

    A ranking is a distribution event. Revenue appears only when that distribution reaches a relevant person, earns enough trust, and offers a clear next action.

    The funnel starts with the impression. The title and thumbnail determine whether the viewer enters. The opening and structure determine whether the viewer stays. The lesson, product demonstration, or point of view determines whether the viewer believes the creator can help with the underlying problem.

    That sequence explains why satisfaction signals matter to revenue-focused creators. A misleading package may create activity at the top of the funnel, but it attracts people who are less likely to trust the channel or take the intended next step. A well-matched video can produce a smaller audience with stronger commercial relevance.

    Use ranking data as a decision system

    Review each upload through four connected questions:

    • Discovery: Did the video reach the audience and topic it was designed for?
    • Viewing: Did the packaging and opening sustain attention?
    • Intent: Did viewers click the relevant link, end screen, or next resource?
    • Revenue: Did a tracked action lead to a sale, lead, booking, or other defined business result?

    YouTube Studio is useful for the first two questions. A tracking and attribution layer is needed for the last two. The combination lets you distinguish a visibility problem from a conversion problem. It also helps you decide whether to improve the existing video, create a related follow-up, change the offer, or stop investing in that topic.

    The next upload should reflect what the data taught you. Keep the elements that produced qualified attention, replace the ones that created mismatch, and preserve a clear record of the experiment. That's how YouTube video rankings become a repeatable revenue process rather than a vanity scoreboard.


    ViewsMax helps creators plan content, publish across channels, and connect trackable clicks, leads, and sales back to the exact content that generated them. Visit ViewsMax to see how attribution can turn ranking and engagement data into clearer content and revenue decisions.

  • How to Get Subscribers on YouTube Fast and Keep Them

    How to Get Subscribers on YouTube Fast and Keep Them

    The median YouTube channel with 1 to 99 subscribers grows by only about 0.5 subscriber per month, according to vidIQ's analysis of more than 61 million channels (vidIQ subscriber growth benchmarks). That changes the question. “How to get subscribers on YouTube fast” isn't mainly about uploading more often. It's about converting the right viewers efficiently, then identifying exactly which videos and surfaces caused those subscriptions.

    YouTube gives creators an enormous discovery environment, but reach alone doesn't create a durable audience. A Short can attract attention, a long-form video can build trust, and a playlist can turn one viewing session into a repeat habit. The channel grows when those pieces work as a connected system.

    Why Fast Subscriber Growth Is Hard and Where Opportunity Lives

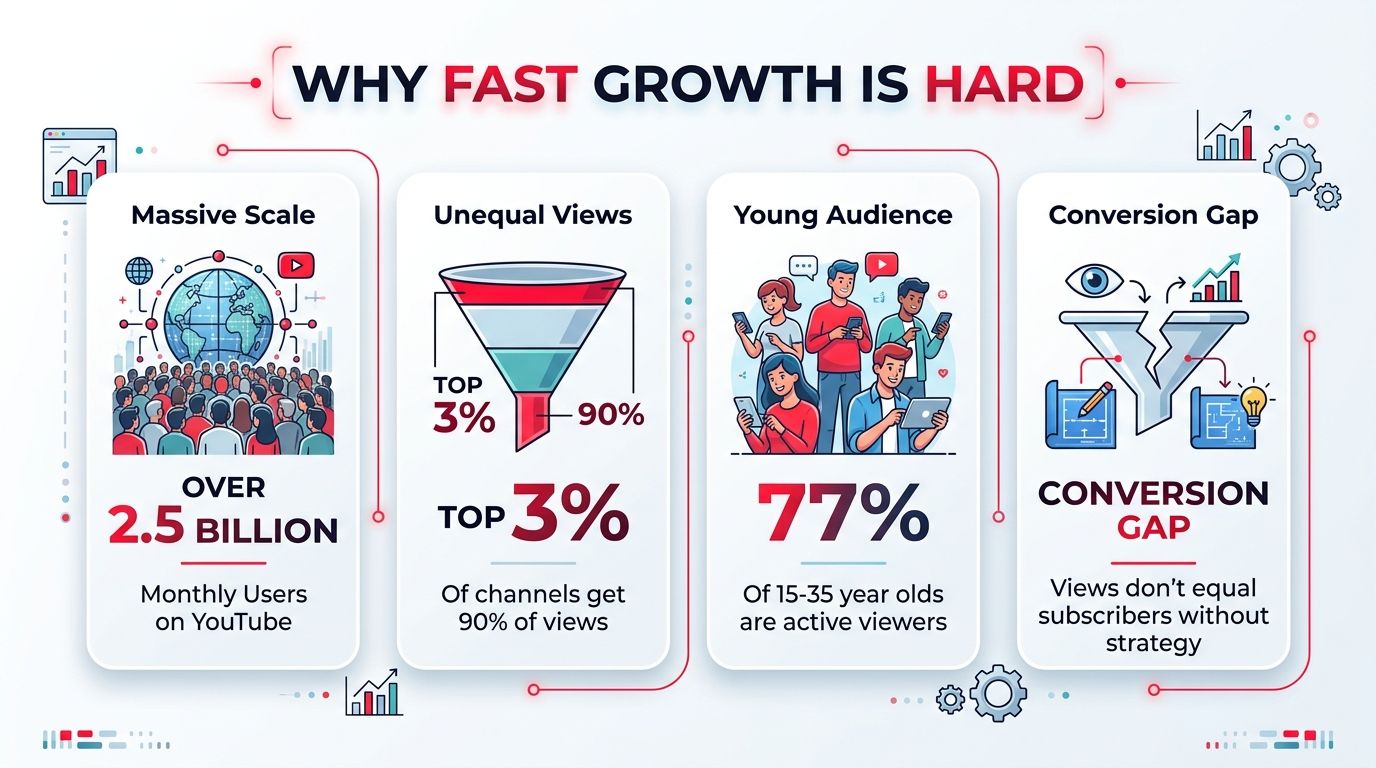
    YouTube reached about 2.72 billion monthly logged-in users and 1.06 billion daily active users by 2026, while India alone was reported at 518 million users in April 2026 (YouTube audience statistics). Its largest global age group is 25 to 34-year-olds at 21.3%, followed by 35 to 44-year-olds at 18.7%. That combination of scale and concentrated adult attention creates real opportunity for tutorials, entertainment, niche commentary, product education, and practical how-to content.

    An infographic titled Why Fast Growth Is Hard, illustrating YouTube's scale, viewer distribution, demographics, and conversion challenges.

    But a large audience doesn't make growth evenly available. vidIQ's dataset shows that 40.6% of channels reached 1,000 subscribers, 7.9% reached 10,000, 1.3% reached 100,000, and only 0.13% reached 1 million (the full channel-scale analysis). Each milestone becomes substantially harder because a channel must earn attention against creators with clearer positioning, stronger libraries, and more established viewer habits.

    Why small channels stall

    Very small channels usually don't have a distribution problem alone. They have a conversion problem hidden inside a distribution problem. A viewer may click because a topic looks useful, watch part of the video, and leave without understanding what the channel consistently offers. Another viewer may enjoy a Short but have no reason to expect the next upload will be relevant.

    That's why upload frequency by itself rarely fixes a stalled channel. Consistency gives YouTube and viewers more opportunities to evaluate your content, but niche clarity, packaging, and retention determine whether those opportunities become repeat viewing and subscriptions.

    A practical audit should ask:

    • Who is this for? Can a new viewer identify the audience without studying the channel page?
    • What promise repeats? Do the videos solve a recognizable class of problems or deliver a consistent type of entertainment?
    • What happens next? Does each video lead to a related video, a playlist, or a clear reason to subscribe?
    • Which content converts? Are you measuring subscribers gained by individual video, rather than judging success by views alone?

    Creators who want to understand the wider operating environment can also explore about the growth platform for additional context on audience and channel growth workflows. For platform changes that may affect discovery and channel behavior, keep a reference such as this guide to changes in YouTube close to your planning process.

    The opportunity is conversion efficiency

    The baseline for tiny channels is sobering. Channels with 1 to 99 subscribers had a median monthly growth rate of 1.26%, or about 0.5 subscriber per month, in the same vidIQ analysis (channel growth distribution). You don't beat that baseline by treating every view as equally valuable. You beat it by finding topics and formats that attract viewers with a strong reason to return.

    Think of every upload as a funnel:

    1. Discovery: A title, thumbnail, search result, recommendation, or Short earns attention.
    2. Trust: The opening confirms the promise and the video delivers useful or entertaining value.
    3. Continuation: The viewer has an obvious next video or series to watch.
    4. Subscription: The channel promise makes following feel worthwhile.
    5. Attribution: You record which video, playlist, or link contributed to the result.

    That final step prevents vanity metrics from controlling your strategy. A video with broad reach but weak subscriber intent may be less useful than a smaller video that attracts viewers who watch again, click an offer, or join the channel. Fast growth comes from increasing the number of qualified viewers who move through the entire path.

    Packaging That Converts Viewers Into Subscribers in Seconds

    A viewer decides whether to continue before your best insight appears. The title, thumbnail, and opening must communicate one clear promise, then prove quickly that the video deserves attention.

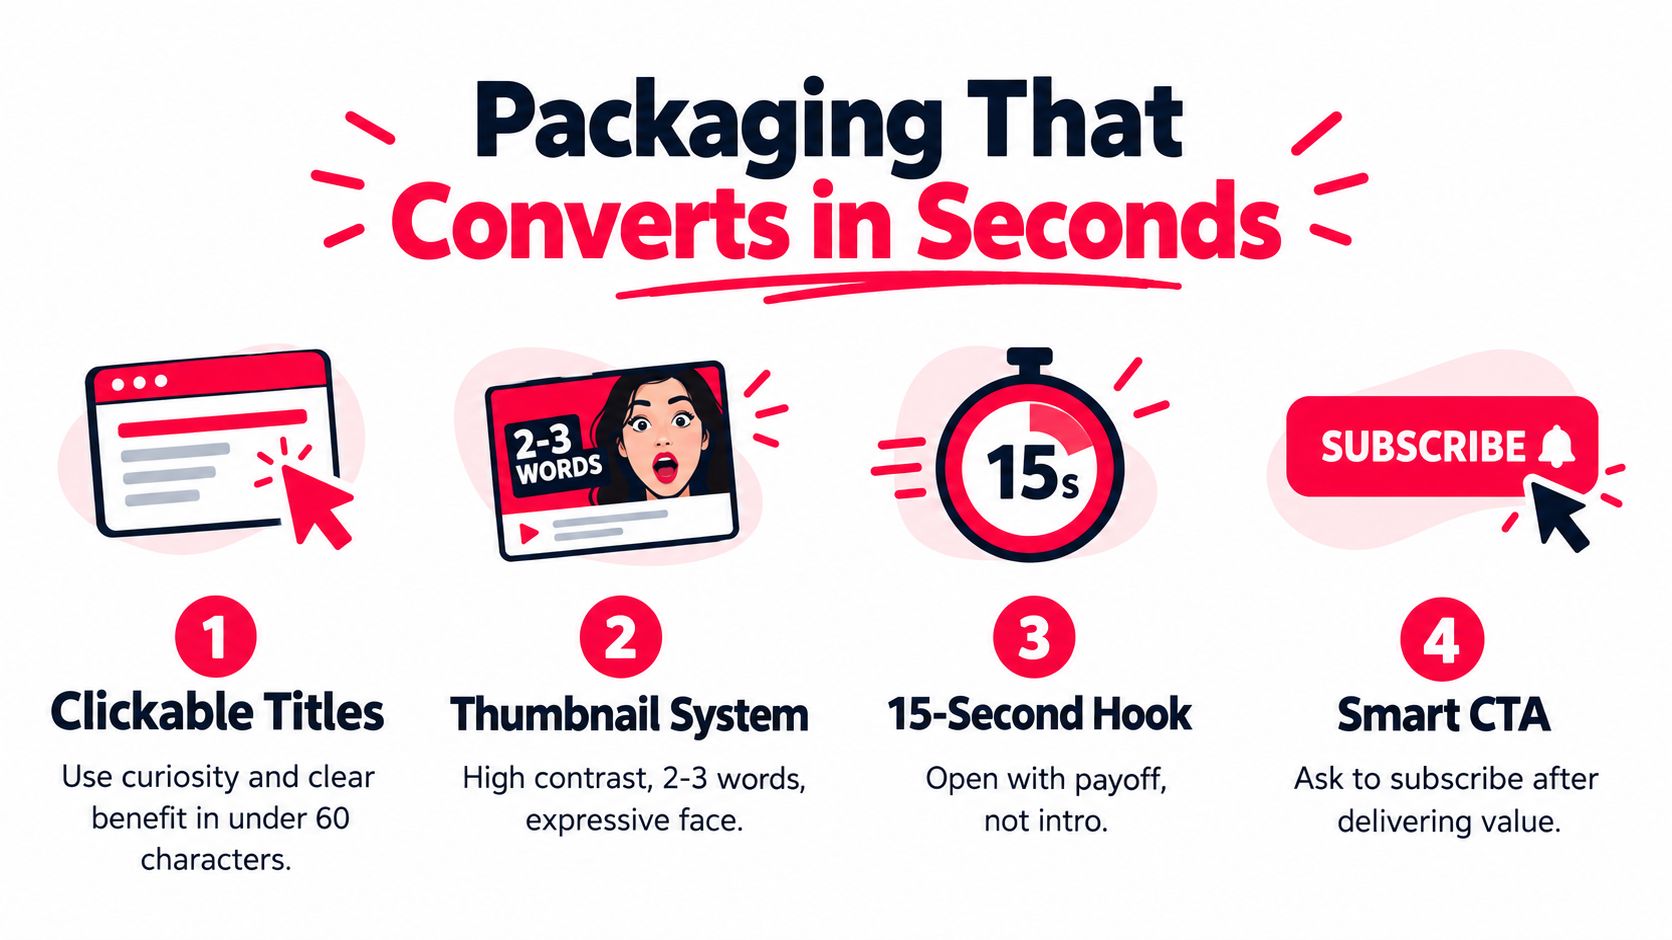
    An infographic showing four key steps to increase YouTube video conversions and subscriber growth effectively.

    Build one promise across title and thumbnail

    Start with the viewer's desired outcome, not your production process. “My Weekly YouTube Workflow” describes your activity. “Turn One Video Into a Week of Content” describes a benefit.

    Weak packaging often contains several ideas at once:

    • Weak title: “YouTube Tips for Beginners”
    • Weak thumbnail: A crowded collage of software windows and tiny text
    • Stronger title: “Your First YouTube Video, Without the Guesswork”
    • Stronger thumbnail: “START HERE”

    The stronger version gives the viewer a recognizable problem and a reason to believe the video will provide direction. The thumbnail shouldn't repeat every word in the title. It should reinforce the central idea visually, with readable text, contrast, and a single focal point. Use the practical principles in YouTube thumbnail best practices when reviewing the design at mobile size.

    Avoid packaging that promises an outcome the video delays or never delivers. A high click-through rate followed by an immediate retention collapse is not a subscriber strategy. It attracts people under the wrong expectation and teaches YouTube that the viewing experience disappoints.

    Win the first one to three seconds

    Shorts need an especially direct opening. The independent benchmark in the Shorts playbook recommends optimizing the first 1 to 3 seconds, keeping the promise narrow, and making the channel identity obvious immediately (Shorts growth methodology).

    For long-form videos, the same principle applies with more room to develop. Remove logo animations, greetings, and general background unless they're essential to the story. Open with one of these structures:

    • Show the result: Display the finished edit, transformation, experiment, or answer.
    • Name the tension: State the mistake or risk the viewer wants to avoid.
    • Set the test: Explain what you'll compare and what decision the viewer will be able to make.
    • Preview the path: Give the viewer the specific steps, not a vague promise to “cover everything.”

    A strong hook doesn't need manufactured drama. It needs specificity. “I tested three ways to turn Shorts viewers into long-form viewers, and one created a much clearer subscriber path” gives the audience a reason to stay without pretending the result is more dramatic than it is.

    Place CTAs after evidence

    A subscribe request before the viewer receives value can feel like a transaction without proof. Deliver a useful insight first, then connect the CTA to the channel promise.

    Promise clarity: Ask viewers to subscribe because they'll want the next relevant outcome, not because the creator wants a larger number.

    Use a soft CTA after the first meaningful payoff. For example, a tutorial creator might say, “If you're building a channel around practical creator workflows, subscribe. The next video covers the publishing system that connects this setup to a repeatable schedule.” This works better than a generic request because it tells the viewer what future subscription value looks like.

    Reserve the harder CTA for a natural transition or the conclusion. Mention the next video, show its thumbnail, and explain why it follows the current one. The viewer should never have to guess what subscribing changes.

    A final pre-publish check:

    1. Does the title promise one outcome?
    2. Does the thumbnail communicate the same idea without becoming a duplicate?
    3. Does the opening prove relevance immediately?
    4. Does the first section deliver a useful result before asking for the subscription?
    5. Does the ending point to one clearly related next action?

    Choosing Formats That Actually Drive Subscribers

    Views and subscribers come from different forms of intent. Shorts can introduce a creator to people who have never encountered the channel. Long-form videos give viewers more time to assess expertise, personality, and consistency. Live content can deepen the relationship, while community posts can keep existing viewers engaged between uploads.

    The right question isn't “Which format gets the most views?” It's “Which format moves this audience from discovery to a durable reason to return?”

    Format Reach Potential Subscriber Conversion Best Use
    Shorts Broad discovery and fast topic testing Often lower efficiency unless the channel promise is obvious Reach new viewers and test hooks
    Long-form More deliberate viewing and deeper trust Independent coverage cites roughly 3% to 8% conversion compared with 0.5% to 2% for Shorts, though results vary by audience and channel (format conversion analysis) Teach, explain, entertain, and build repeat viewing
    Live Direct interaction and community depth Strongest when viewers already have a reason to participate Answer questions, review work, and strengthen loyalty
    Community posts Re-engagement with people who already know the channel Better for nurturing than cold discovery Poll viewers, preview topics, and restart conversations

    Use Shorts as an entry point, not the whole strategy

    Independent benchmark data places typical Shorts-to-subscriber conversion around 0.5% to 3%. It also estimates that a million-view Short may produce roughly 5,000 to 30,000 subscribers on strong channels, while weaker channel-brand pull may yield only 500 to 3,000 (Shorts conversion benchmarks). Those ranges are wide because a view doesn't prove that the viewer understands or wants the channel.

    Build the bridge deliberately:

    • Series framing: Label the Short as part of a sequence, so the viewer expects another installment.
    • Visible identity: Show the channel name, recurring visual treatment, or recognizable host early.
    • Related destination: Route the viewer to one long-form video or playlist that expands the same promise.
    • Consistent topic: Don't use a viral Short about an unrelated subject to promote a channel built around something else.
    • Specific CTA: Ask the viewer to watch the full breakdown, follow the series, or subscribe for the next part.

    A Short about fixing a microphone should lead to a longer guide about recording clean audio, not a general channel homepage filled with unrelated uploads. Relevance does the conversion work.

    Choose format by intent

    Long-form should carry the core promise when the subject needs demonstration, context, or a complete process. A software tutorial, buying guide, or detailed analysis usually gives the viewer enough evidence to decide whether your channel deserves a place in their routine.

    Live content is different. It can create stronger loyalty, but it usually performs poorly as a first introduction unless the topic or creator already has pull. Use it to answer recurring questions, review subscriber submissions, or develop ideas that later become edited videos.

    Community posts help you keep attention warm. Ask a focused question tied to the next upload, share a decision between two topics, or publish a short follow-up that rewards people who watched the main video. For more tactical ideas on discovery content, use this Shorts views guide as a planning reference.

    The most efficient mix is usually a discovery layer plus a depth layer. Shorts find potential viewers. Long-form earns confidence. Playlists and follow-up posts make returning easy.

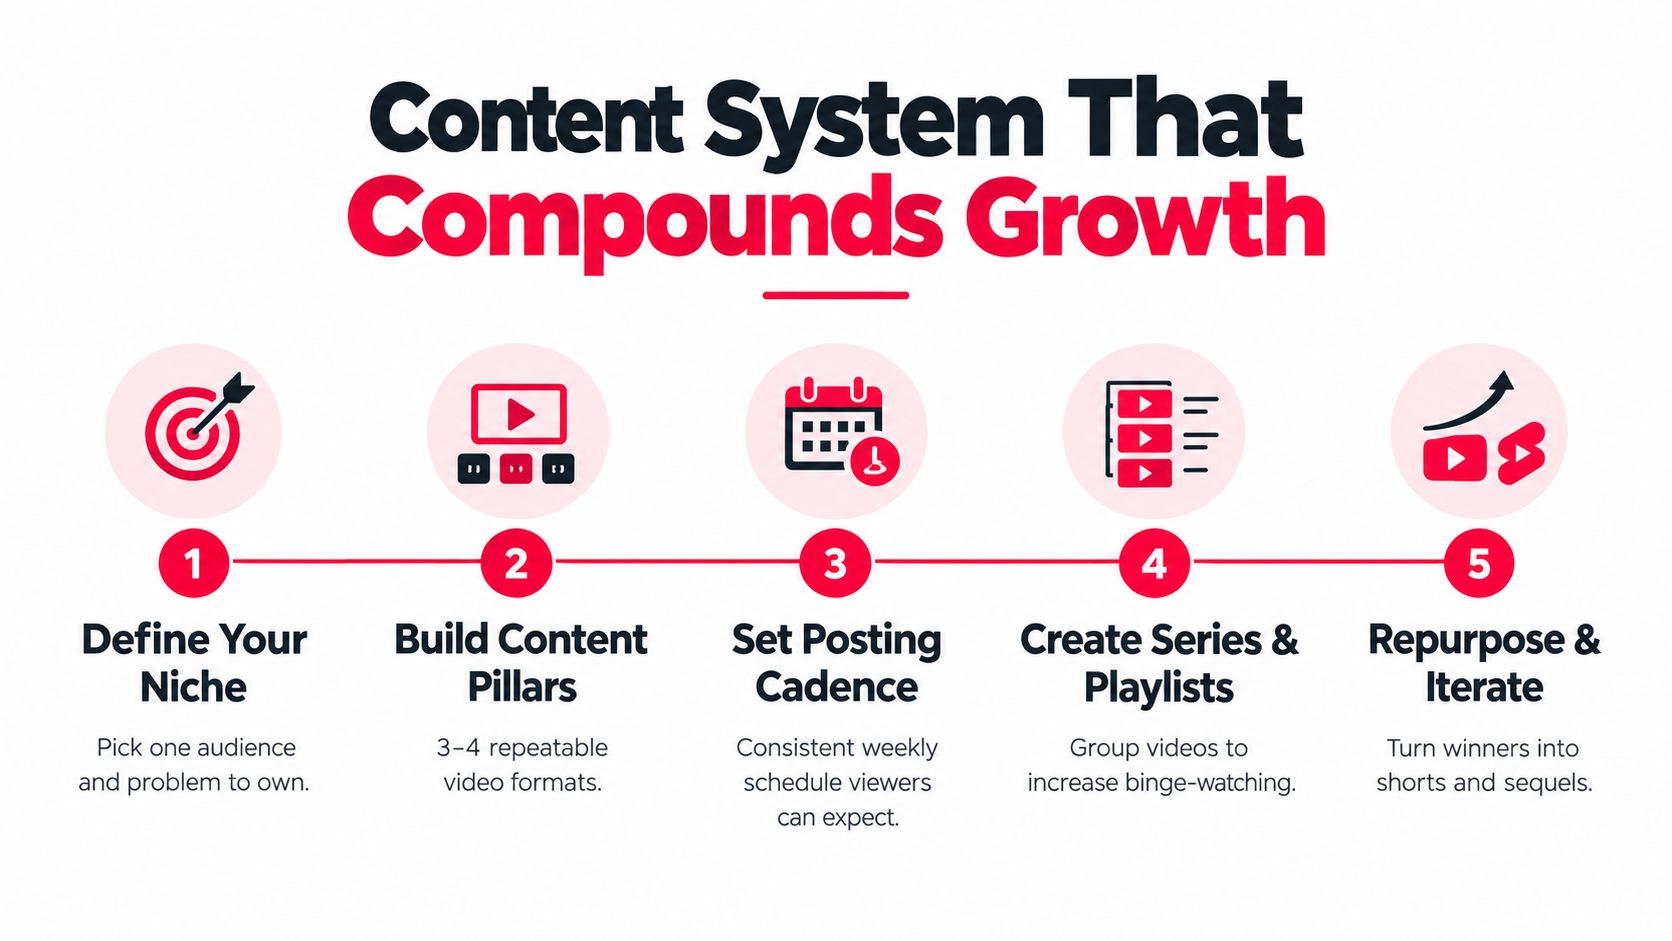
    Building a Content System That Compounds Growth

    A channel compounds when each upload creates demand for another upload. That requires more than a list of unrelated ideas. It requires a clear audience, repeatable pillars, and a path that makes the next viewing decision simple.

    A five-step guide illustration showing how to build a content system for YouTube growth and channel success.

    Start with a narrow promise

    Choose one audience and one recurring problem or interest you can serve repeatedly. “People interested in business” is too broad to guide programming. “Freelancers who need simple client acquisition systems” gives you a clearer set of topics, examples, and future products.

    Write the promise in one sentence:

    For [specific audience], I publish [repeatable format] that helps them [specific outcome].

    Then build three or four content pillars around that promise. A creator-focused channel might use channel strategy, video production, audience research, and monetization. The pillars should generate multiple episodes, not merely describe categories.

    Plan a calendar that you can maintain

    The available benchmark data links 12 or more posts per month with roughly 66% more subscribers than lower-frequency publishing, while coverage on combined Shorts and long-form reports channels growing about 41% faster (subscriber strategy analysis). These are correlations, not guarantees, so don't treat the cadence as a promise that any channel will reproduce the same outcome.

    Use the finding as a planning constraint, not a demand to publish low-quality work. Batch research, outlines, filming, and editing separately. One substantial video can supply several Shorts, a community prompt, and a follow-up topic without forcing you to invent a new concept every day.

    A practical monthly system might include:

    • Core videos: Publish the deeper pieces that establish expertise and give viewers a reason to subscribe.
    • Discovery clips: Extract focused moments that stand alone and point back to a related core video.
    • Conversation posts: Ask questions, preview decisions, and collect objections that can shape future scripts.
    • Continuation videos: Turn a successful topic into a sequel, comparison, or advanced version.

    Make the library navigable

    Create playlists around outcomes rather than upload dates. “Improve Your YouTube Hooks” is more useful than “Videos from March” because it tells a new viewer what they'll achieve by continuing.

    Each core upload should have a deliberate neighbor. Add the related video to the description, pinned comment, and end screen. Keep the destination narrow. A viewer who finishes a video about thumbnails should see another packaging lesson, not a random vlog.

    Cross-promotion can extend the system outside YouTube. Adapt the idea for newsletters, Instagram Reels, TikTok, LinkedIn, or relevant communities, but change the framing for the platform. A clip should create interest in the full video without pretending the short version contains the entire answer.

    If your workflow includes written tutorials, product documentation, or scripts, it may help to evaluate technical writing tools before choosing a production process. The principle is the same across formats. Reduce repetitive work so more attention goes toward research, clarity, and audience fit.

    Retention and Optimization That Turns Views Into Loyalty

    Subscriber growth often improves faster when you repair existing videos than when you add more work to the calendar. A video that earns clicks but loses viewers during its opening has a packaging or expectation problem. A video that holds attention but produces few subscriptions has a promise, routing, or CTA problem.

    A woman looks at a laptop screen displaying audience retention analytics and metrics for a video project.

    Read the retention curve as a diagnosis

    Start with the first major drop. If viewers leave before the first useful point, inspect the opening for delays, vague framing, or a mismatch between title and delivery. If the curve falls after a section transition, the structure may be unclear or the next point may not feel connected to the original promise.

    Don't optimize retention as an abstract score. Ask what the viewer expected at each moment and whether the video gave them a reason to continue. A tutorial can retain attention by showing progress. A commentary video can maintain momentum by introducing evidence, tension, or a clear sequence of questions.

    Use a simple decision process:

    • Early drop: Rewrite the first lines, remove setup, and show the payoff sooner.
    • Mid-video drift: Shorten repeated explanations and add stronger transitions.
    • Late abandonment: Move the most important conclusion earlier and make the next step visible.
    • Healthy viewing but weak subscriptions: Clarify the channel promise and place a relevant CTA after the strongest value moment.

    Improve the paths around the video

    End screens should lead to one logical continuation. Choose the next video based on the viewer's current problem, not the upload you happen to want to promote. A pinned comment can repeat that path in plain language, while a playlist can give viewers a structured sequence instead of a single isolated recommendation.

    Cards can support a reference point when a related explanation would interrupt the current video. Use them sparingly. Too many choices create friction and distract from the main narrative.

    Titles and thumbnails also deserve ongoing testing. Change one variable at a time when possible, record what changed, and judge the result alongside retention and subscribers gained. A more clickable thumbnail that attracts the wrong audience isn't an improvement.

    Track conversion and attribution

    For each video, record views, subscribers gained, and the resulting subscriber conversion rate. The basic calculation is:

    Subscribers gained ÷ views × 100

    Compare videos within the same format and audience intent. A Short should not be judged by the same conversion expectation as a long-form tutorial. Also record which playlist, end screen, pinned comment, or external link helped the viewer continue.

    ViewsMax can sit alongside YouTube Analytics when the channel has an offer behind the content. It lets creators create trackable links and connect clicks, leads, and sales back to specific content, which adds a revenue attribution layer to subscriber analysis. That distinction matters because a video can be valuable even when it doesn't produce the highest public view count.

    Your 30 and 90 Day Plan to Accelerate Subscribers

    Fast growth needs a short feedback cycle and a longer operating horizon. Use the first month to identify conversion patterns, then use the following two months to build around the formats and topics that attract the right viewers.

    The first 30 days

    Days 1 through 7 should establish a baseline. Export or record each recent video's views, subscribers gained, average view duration, click-through rate, and traffic source. Mark the videos that produce subscriptions efficiently, then inspect their topic, opening, structure, and next-video path.

    Days 8 through 14 should repair the channel journey. Rewrite unclear titles, refresh thumbnails where the promise is weak, add relevant end-screen destinations, and organize the strongest related videos into outcome-based playlists. Give every active upload one obvious continuation.

    Days 15 through 21 should test a format bridge. Create Shorts from ideas that already connect to your strongest long-form topics. Add on-screen identity, keep each promise narrow, and route viewers to the matching full video or playlist. Track subscriber gains by Short rather than assuming views represent success.

    Days 22 through 30 should repeat the strongest pattern. Publish another core video based on the topic or structure that produced qualified subscribers, then support it with discovery content and a conversation post. Compare the new results with your baseline, not with a creator in a different niche.

    The 90-day operating plan

    During the next two months, turn your findings into a programming system. Keep a record of:

    • Subscriber conversion per video: Which topics and formats turn viewers into subscribers?
    • Average view duration: Where do people continue, skip, or leave?
    • Click-through rate: Which title and thumbnail combinations earn qualified clicks?
    • End-screen movement: Which destinations cause viewers to continue watching?
    • Attributed clicks and sales: Which content drives business outcomes, not just attention?

    Use weekly reviews to choose the next topic. Use monthly reviews to decide which pillar deserves more production capacity. If a format earns views but attracts no repeat behavior, reduce its role or redesign the bridge. If a smaller topic consistently produces subscriptions and qualified clicks, make it a recurring series.

    ViewsMax can support this workflow by placing trackable links, content planning, publishing, and click, lead, and sales reporting in one workspace. The practical outcome is a clearer connection between each video and the action that follows it.

    The operating checklist is short:

    1. Define one audience and one repeatable promise.
    2. Package every video around one outcome.
    3. Hook viewers immediately.
    4. Use Shorts for discovery and long-form for depth.
    5. Route every viewer toward one relevant next step.
    6. Measure subscribers gained per video.
    7. Attribute clicks, leads, and sales to the content that generated them.
    8. Repeat the formats that create both audience growth and meaningful action.

    Use ViewsMax to plan content, publish across channels, create trackable links, and connect clicks, leads, and sales to the exact videos that generated them. Start by reviewing your last uploads, identify the pieces with the strongest subscriber and business intent, and build your next 30-day calendar around those patterns.

  • TubeBuddy for YouTube: A 2026 Guide for Creators

    TubeBuddy for YouTube: A 2026 Guide for Creators

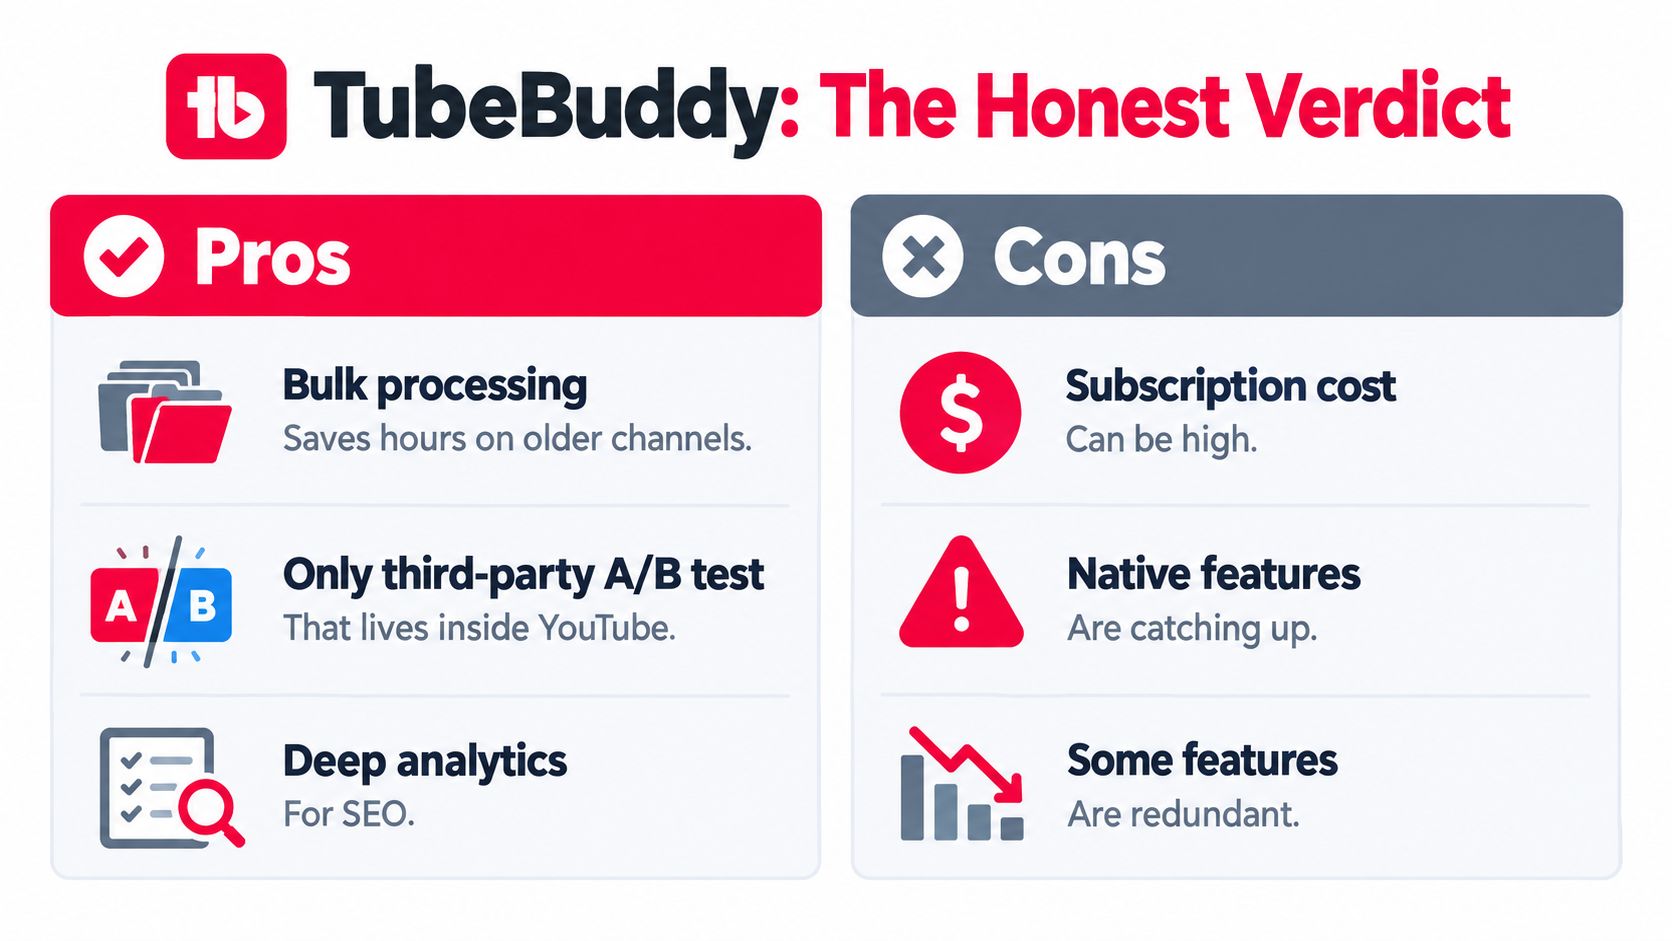
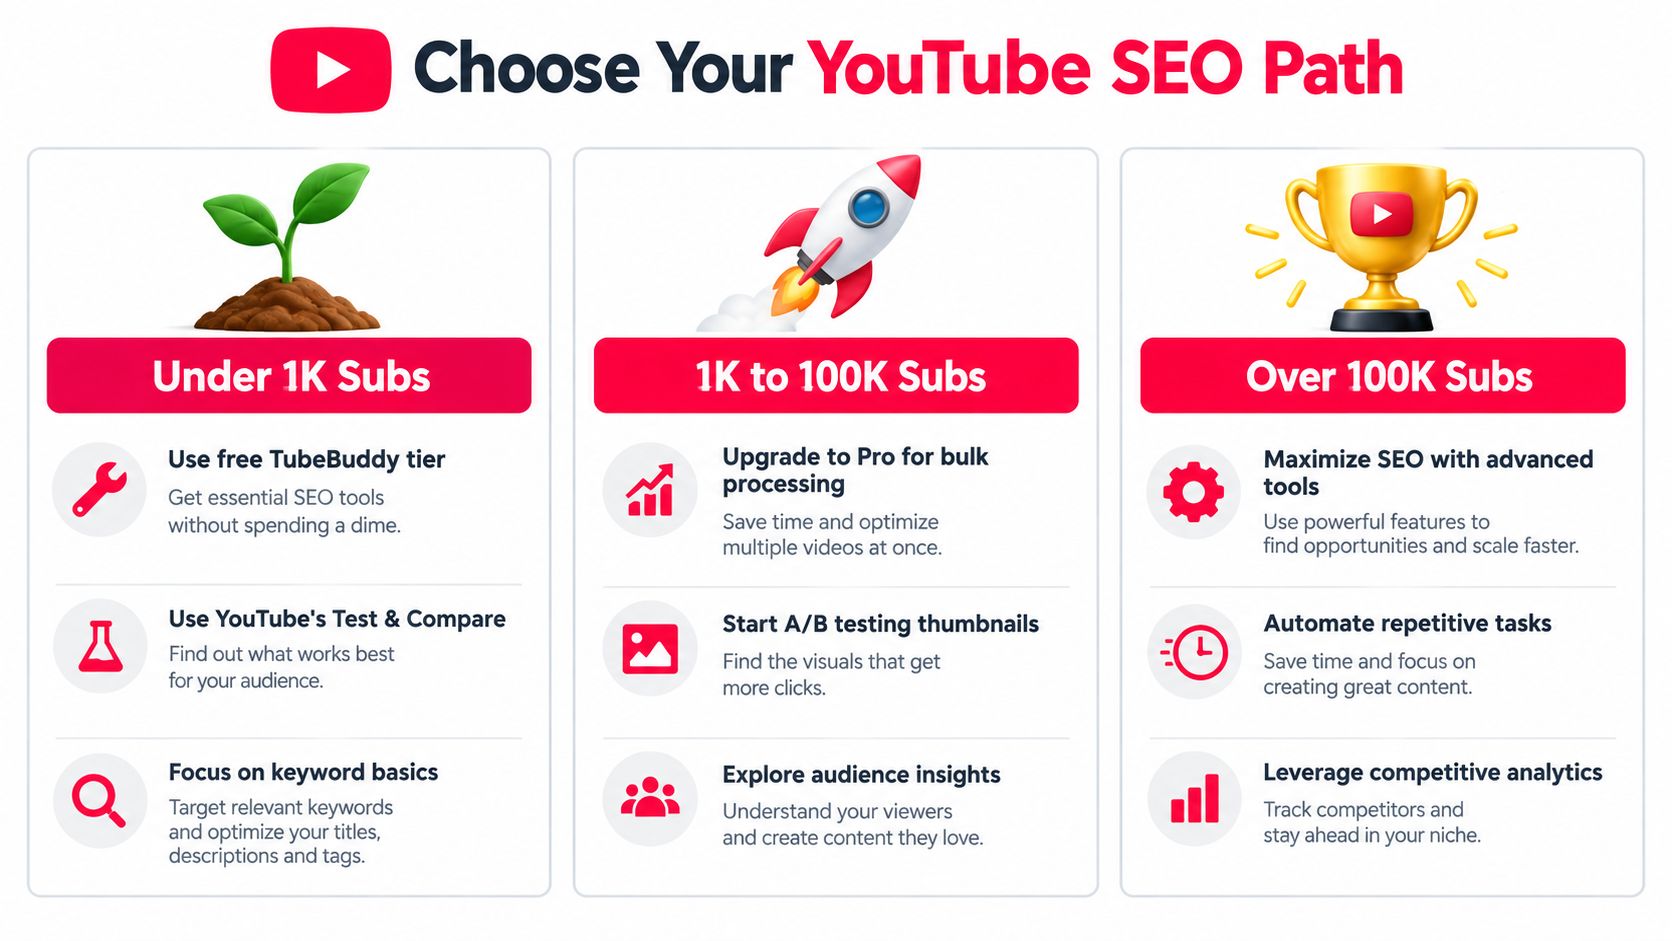
    Most advice about TubeBuddy for YouTube is stuck in the past. It still treats thumbnail A/B testing as the decisive reason to subscribe, even though YouTube's native Test & Compare has absorbed much of that job. The better question in 2026 isn't whether TubeBuddy can optimize a video. It can. The question is whether its remaining workflow shortcuts save enough time, across enough uploads and channels, to justify another subscription.

    That distinction matters because optimization and business measurement aren't the same thing. TubeBuddy can help you research keywords, clean up metadata, compare test variants, and manage a catalog. It won't automatically tell you which video drove a product sale, booked a call, or justified a sponsorship. If you're publishing for revenue, not only rankings, you need to evaluate TubeBuddy as one layer in a larger operating system.

    Why TubeBuddy Still Matters in 2026

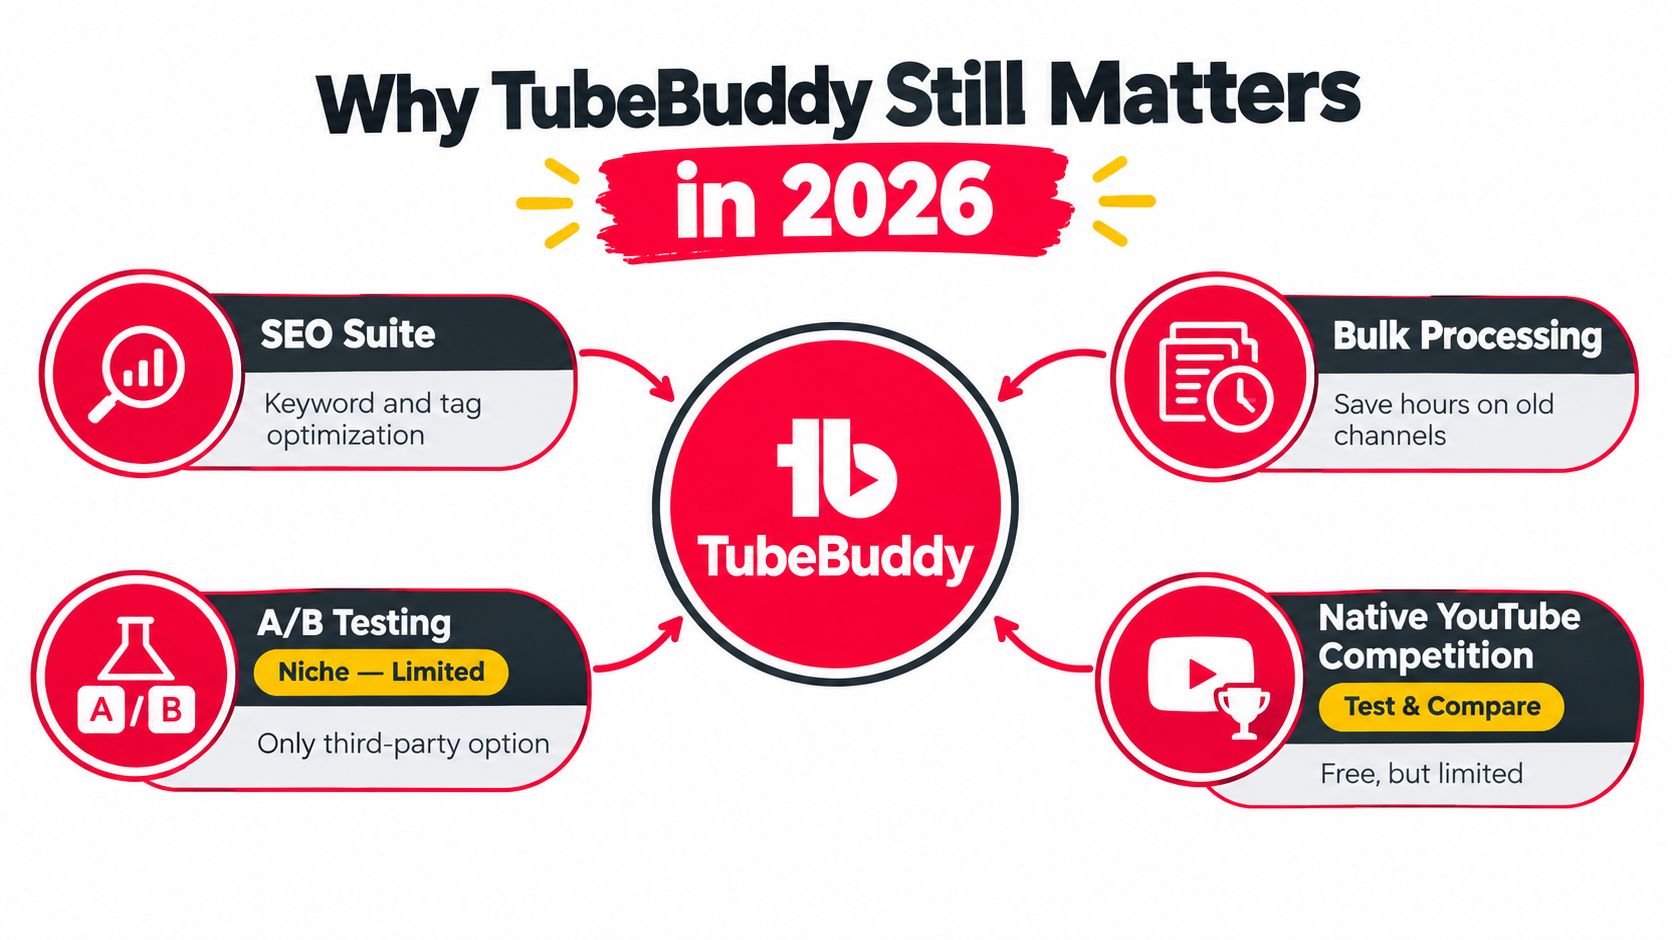
    TubeBuddy's famous advantage is no longer enough to justify a subscription. YouTube's native Test & Compare now lets creators test thumbnails, so a third-party thumbnail feature has lost much of its former appeal. An independent TubeBuddy review reaches the same conclusion, describing thumbnail testing as a weaker differentiator now that YouTube handles much of the job itself.

    TubeBuddy still earns its place as a workflow utility. Its practical value sits in repetitive channel operations that YouTube Studio handles less efficiently, including bulk metadata edits, tag organization, channel audits, and optimization prompts during upload. That matters most for creators managing a substantial video library or publishing across multiple channels.

    TubeBuddy was founded in 2014 and acquired by BEN on October 29, 2020, according to an independent company profile (TubeBuddy company history). The product developed alongside more professional YouTube operations, where maintaining a growing catalog created work beyond writing titles and selecting keywords. Its broad creator adoption shows that the utility scaled, but adoption alone does not justify a paid plan for every channel.

    A graphic explaining why TubeBuddy remains valuable in 2026, highlighting features like SEO, bulk processing, and testing.

    The remaining reasons to keep it

    The strongest case appears after a channel has accumulated a library. Updating cards, end screens, descriptions, and other metadata one video at a time consumes attention better spent on scripting and publishing. Bulk processing turns that maintenance into a repeatable task.

    Keyword suggestions and tag workflows remain useful when they support a defined publishing plan. They can help compare candidate phrases and keep metadata consistent, but they cannot fix weak topics, unclear positioning, or videos that fail to deliver on the title. TubeBuddy's milestone system also presents growth through concrete markers such as subscribers and views, including public examples of a channel reaching 870,000 subscribers and 27,000,000 views (TubeBuddy milestone pages).

    Practical rule: Pay for TubeBuddy when it removes recurring channel work. Do not pay because an extension displays an SEO score.

    Revenue attribution remains the missing piece. A higher tag score, stronger click-through rate, or cleaner catalog does not prove that a video generated a product sale, booked a call, or supported a sponsorship. Creators publishing for revenue should judge TubeBuddy as an operations layer, then measure business outcomes elsewhere. Once optimization stops being the main constraint, production, offers, and attribution deserve the attention.

    How TubeBuddy Fits Into a Creator's Workflow

    TubeBuddy earns its place as a recurring workflow utility, not as a browser extension installed once and ignored. The extension handles tasks within YouTube, while the web dashboard supports broader reporting and channel management. Give each visit a clear trigger, or the tool becomes another tab competing for attention.

    The night before publication

    Research the topic before opening the upload page. Use Keyword Explorer and related discovery tools to compare possible phrases, then choose a subject that fits your audience and the video you can produce. Keyword data should shape the framing, not force an awkward title that the video cannot support.

    Planning belongs beside production. If you're creating videos for your campaign, define the audience action and content angle before polishing metadata. A keyword may earn a click, but the opening, structure, and offer determine whether that attention produces a useful result.

    During the upload

    The browser extension places optimization prompts inside YouTube's publishing flow. Review suggested tags, title wording, description structure, and the checklist while the video is still being prepared. That placement reduces context switching and makes routine metadata decisions faster.

    Treat the score as a checklist, never as a verdict. YouTube's native Test & Compare has absorbed much of the attention once associated with TubeBuddy's testing tools, so TubeBuddy's remaining advantage is workflow speed and organization. A high score cannot repair a vague promise, weak thumbnail, or topic that misses subscriber interests. For more browser-based workflow ideas, see this guide to Chrome extensions for YouTubers.

    Weekly and monthly maintenance

    Reserve a regular session for older uploads. Bulk tools can update descriptions, cards, end screens, and other repeated elements across a catalog. For a channel with a growing library, that maintenance can justify a paid license more clearly than another keyword suggestion.

    Use the dashboard for channel-level review instead of checking videos at random. On a scheduled review day, find titles with weak impressions-to-click performance, compare their packaging with stronger uploads, and create a short test list. TubeBuddy's milestone data typically refreshes every two hours, while some externally sourced view metrics can lag 24 to 48 hours, according to its support documentation.

    Track revenue separately. Better packaging or cleaner metadata does not prove that a video generated a sale, booked a call, or supported a sponsorship. Once optimization stops limiting growth, shift attention to production, offers, and attribution.

    The Four Core Feature Areas Explained

    TubeBuddy is easier to judge by workflow than by feature count. Its tools fall into four jobs: researching a topic, maintaining a video library, testing packaging, and reading channel performance. The first and third attract attention, but bulk maintenance is often the clearest reason to pay.

    Keyword and tagging tools

    The keyword group covers keyword exploration, upload-time tag suggestions, saved tag lists, and search-rank tracking. These features help an active creator compare wording quickly after the niche and audience are already understood. They cannot supply a content strategy by themselves.

    Use a separate foundation for YouTube video keywords before treating any TubeBuddy score as a decision. Search volume, phrasing, audience intent, and the strength of competing videos matter more than a single rating.

    The paid limits also deserve attention. Independent reviews note that the free tier's keyword allowance can run out quickly, while paid access depends on the selected plan and available features (TubeBuddy review and limitations). A subscription does not remove the need to choose research targets carefully.

    Verdict: Pay for keyword access when the channel publishes around a repeatable topic strategy. Do not buy it in the hope that tags will reveal the strategy.

    Bulk processing and catalog maintenance

    Bulk operations are TubeBuddy's strongest remaining paid use case. Depending on the plan, creators can update cards, end screens, descriptions, thumbnails, comments, and other channel settings across multiple videos. The value comes from removing repetitive edits, not from adding another dashboard.

    This feature becomes more useful as the catalog grows. A creator changing an offer, replacing a destination page, or standardizing descriptions can apply the same maintenance pattern across selected uploads instead of opening each video individually. Agencies and channel managers also gain time when similar updates repeat across client libraries.

    Set the affected video group before applying a broad change, and preserve the original format in a record. A fast bulk edit can create a larger cleanup task if the selection or replacement text is wrong.

    Verdict: Bulk editing is the clearest reason to move beyond free access for a mature catalog.

    A/B testing

    TubeBuddy's testing tools compare metadata variants on a scheduled cycle, often changing the active version once per day at a set time. The system can stop after a selected duration or after reaching statistical significance. Results therefore reflect day-level sampling rather than continuous randomized traffic allocation.

    The reporting view includes click-through rate, watch time per impression, engagement rate, daily impressions, clicks, and total views for each variant. It can also separate results by traffic source or subscriber status, helping identify whether a result came from discovery, returning viewers, or external promotion (TubeBuddy YouTube A/B testing overview).

    YouTube's native Test & Compare has absorbed much of the attention once attached to TubeBuddy's testing feature, especially for thumbnail experiments. TubeBuddy still fits creators who want testing inside a wider publishing workflow or who value third-party reporting. It is a weak subscription reason when thumbnail comparison is the only job.

    Verdict: Use A/B testing to answer a specific packaging question. Do not make it the central reason to subscribe.

    Analytics and channel health

    TubeBuddy's analytics tools combine packaging signals with channel diagnostics. Comparing click-through rates, viewing performance, and health indicators can show where an upload deserves attention. The useful output is a decision, not a score.

    A weak title may call for a rewrite. A thumbnail problem may require a new visual idea. Low retention may point to the opening, while weak topic selection requires a change before the next upload. Revenue attribution still sits outside this optimization layer, so connect these findings with sales, bookings, affiliate activity, or sponsorship outcomes in a separate measurement system.

    Feature Area What It Does 2026 Verdict
    Keyword and tagging Supports keyword exploration, tag suggestions, lists, and rank tracking Useful for active channels with a defined niche
    Bulk processing Updates repeated metadata and channel elements across a library Strongest paid justification
    A/B testing Compares variants on a scheduled testing cycle Helpful, but no longer uniquely necessary
    Analytics Surfaces packaging, engagement, and channel-health signals Valuable when tied to concrete actions

    Verdict: Analytics can sharpen publishing choices, but optimization does not prove business impact. Once packaging stops limiting growth, measure revenue and improve the offer, production, and attribution system.

    Two Creator Workflows in Practice

    Feature lists become useful only when they fit a real publishing day. Consider a gaming creator who publishes twice each week. The creator researches a target phrase before recording, checks related suggestions, and saves a short list of relevant tags for the upload rather than stuffing every possible phrase into the metadata.

    During publishing, the creator uses the extension to review the title, description, and tags inside YouTube Studio. The thumbnail goes into a TubeBuddy test only when the packaging question is specific, such as whether a character-focused image outperforms a result-focused image. After the test runs, the creator reviews click-through rate, watch time per impression, and traffic-source segments instead of selecting a winner based on clicks alone.

    The following week, the creator turns the result into a publishing decision. If one concept attracts discovery traffic but weakens viewing quality, it shouldn't automatically become the default. If the result is unclear, the creator keeps the stronger editorial version and tests a different variable later.

    A female video editor wearing a headset works at her desk with dual computer monitors and keyboard.

    A small ecommerce channel

    Now take a product-review creator with a substantial backlog. The immediate problem isn't finding another keyword. It's that older videos point viewers toward outdated cards and end screens.

    The creator first exports or reviews click-through information to identify videos that still attract attention but send viewers nowhere useful. Next, they use bulk editors to update cards and end screens across the relevant catalog. Titles that remain weak after the destination cleanup go into a separate review list, where the creator changes metadata in batches rather than editing unrelated videos.

    The free tier becomes a constraint when research, testing, or batch actions exceed the available allowance. That's the decision point. If the creator performs this maintenance once and never returns, a temporary upgrade may be enough. If catalog cleanup is part of every month's operating routine, a paid plan has a more defensible role.

    The right workflow starts with a business or audience problem, then selects the TubeBuddy feature that removes the bottleneck.

    TubeBuddy Pricing Tiers Compared

    TubeBuddy's plan names are easier to understand when you ignore the promotional hierarchy and map them to actual work. Free access suits basic experimentation. Pro is aimed at creators who need more regular optimization and productivity support. Star and Legend are for deeper access, heavier testing, broader reporting, or more advanced channel operations, depending on the current plan configuration.

    The licensing model deserves attention before you subscribe. A standard license is tied to one YouTube channel, not to an account, according to TubeBuddy's pricing information (TubeBuddy pricing and plan details). If you operate multiple channels, calculate the workflow value per channel rather than assuming one subscription covers everything.

    Feature Free Pro Star Legend
    Core optimization Basic access Broader creator tools Expanded access Full advanced access
    Keyword research Limited More practical for active use Deeper access Full search and SEO access
    Bulk operations Limited or unavailable Select productivity features Broader editing access Advanced bulk processing
    A/B testing Limited or unavailable Plan-dependent access Expanded access Highest available access
    Analytics Basic channel signals More reporting Deeper reporting Advanced analytics
    Best fit New or occasional creators Consistent single-channel creators Serious operators Advanced creators and larger workflows

    The exact feature mix can change, so check the live plan comparison before paying. Don't buy Star or Legend because the feature list looks complete. Buy them only when a specific recurring task, such as deeper reporting, broader testing, or catalog operations, is blocked by a lower tier.

    Who should stay with Pro

    Pro is usually enough for a creator who manages one channel, publishes consistently, and wants keyword tools plus practical productivity features. It's also the sensible starting point for testing whether TubeBuddy becomes part of your routine. If you don't use the extension during uploads or schedule maintenance sessions, a higher tier won't fix the adoption problem.

    Who needs an upper tier

    Higher tiers make sense for creators who run frequent controlled tests, manage complex catalogs, or need advanced reporting. They may also suit agencies and channel operators, but per-channel licensing can make the economics less attractive as the channel count grows.

    A simple rule works well: choose the lowest tier that supports the workflow you'll repeat every week. Upgrade only after you can name the blocked task and estimate the time it costs you.

    Honest Pros and Cons for Today's Creators

    TubeBuddy's value has shifted. It still handles repetitive YouTube work better than Studio, especially once a channel has enough videos for manual edits to become a real operational burden. Keeping optimization prompts beside the upload workflow also reduces context switching.

    Its strongest case now is workflow management, not thumbnail testing alone. TubeBuddy organizes testing and reporting more clearly than a casual native workflow, while YouTube's Test & Compare has absorbed much of the feature that once made TubeBuddy an obvious purchase. The company has grown from its 2014 launch into a platform positioned for millions of creators, but that history does not justify paying for features you will not use.

    A graphic comparing the pros and cons of using the TubeBuddy tool for YouTube channel management.

    Where it falls short

    The larger weakness is strategic. TubeBuddy can improve known content, yet it does not show which video produced a sale, membership, or lead. Better titles and thumbnails may raise performance without answering whether the resulting attention created revenue. Pair optimization with attribution once the channel supports a business, not just an audience.

    Pricing and licensing add friction. Per-channel access, sharp tier jumps, and keyword limits can matter when the tool becomes part of a serious routine. One channel may absorb those costs more easily. Several channels make separate licensing harder to justify.

    Start with YouTube's native Test & Compare if thumbnail testing is your only reason to subscribe. TubeBuddy earns its place when bulk editing, channel maintenance, and broader reporting save time every week.

    Maturity test: TubeBuddy suits creators who know what they want to test. It cannot replace learning why viewers choose, watch, and buy.

    TubeBuddy Versus ViewsMax and Other Alternatives

    TubeBuddy and VidIQ are usually compared as if the winner must own every part of the YouTube workflow. That framing is too narrow. Both tools focus primarily on discovery, optimization, packaging, and competitive signals. The more important question is what happens after a viewer clicks.
    TubeBuddy can help you improve the path from topic to search visibility to packaging. VidIQ provides another optimization approach with its own research and competitor-oriented workflows. Neither category automatically proves that a video generated a sale, lead, booked call, or partner outcome.

    ViewsMax belongs downstream from optimization. It provides attribution tracking that lets creators create trackable links, place them in descriptions, bios, and posts, and connect clicks, leads, and sales to content. That makes it a different layer, not a direct replacement for keyword research or channel maintenance.

    Tool Primary Focus Pricing Model Best For Main Limitation
    TubeBuddy YouTube optimization and workflow management Tiered creator licenses Metadata, bulk maintenance, testing, and channel operations Doesn't by itself prove revenue attribution
    VidIQ Topic discovery, keyword research, and competitor analysis Tiered subscription Creators seeking research and idea support Optimization signals don't equal sales proof
    ViewsMax Content attribution and publishing workflow Product-specific subscription model Creators connecting content to clicks, leads, and revenue Not a replacement for YouTube SEO tooling

    The right stack depends on the job. A new creator may need only YouTube Studio and basic TubeBuddy support. A research-heavy channel might compare TubeBuddy with VidIQ, but using both can create duplicate dashboards unless each tool has a clearly assigned role. Once monetized traffic matters, add an attribution layer so packaging improvements can be judged by business outcomes.

    Creators buying promotion or building paid distribution should also separate content optimization from audience targeting. A practical guide to finding effective YouTube Ads targeting can help with the media side, while TubeBuddy remains focused on the channel and ViewsMax tracks downstream actions.

    For a broader tool comparison, use this guide to the best YouTube SEO tools. The key decision isn't which dashboard has the most features. It's whether you need better discovery, faster channel operations, or proof that content produces revenue.

    Choosing the Right Path for Your Channel Stage

    A small channel shouldn't buy an advanced workflow before it has a publishing habit. If you're under 1,000 subscribers, start with TubeBuddy's free tier and YouTube's native Test & Compare. Focus on clear topics, accurate titles, useful descriptions, and consistent calls to action. Use your time to publish and learn what your audience responds to, not to maintain a complicated optimization stack.

    A helpful infographic outlining recommended YouTube SEO strategies for channels at different subscriber count milestones.

    The growing channel

    Between 1,000 and 10,000 subscribers, TubeBuddy Pro can become useful if you publish consistently and need stronger keyword workflows, tag lists, or recurring catalog maintenance. The upgrade should follow a real bottleneck. If uploads are irregular and you rarely review old videos, the paid features will sit unused.

    Build a simple weekly rhythm:

    • Before recording: Choose the topic and audience promise.
    • Before publishing: Review title, description, tags, and thumbnail.
    • After publishing: Record the result and identify one packaging question.
    • During maintenance: Update cards, end screens, or descriptions where the next action has changed.

    The size of the channel matters less than the complexity of the operation. A smaller channel with a large catalog may benefit from bulk editing sooner than a larger channel with a simple publishing model.

    The monetized channel

    Once you're above 10,000 subscribers and monetized, stop treating optimization as the complete growth system. Better titles and thumbnails still matter, but their value should be measured against the revenue or business outcome they support. If sponsorships require performance proof, you manage multiple revenue streams, or you need to compare YouTube earnings with product sales, TubeBuddy alone is no longer enough.

    Watch for these signals:

    • Revenue ambiguity: You can see views but can't identify which videos drive sales.
    • Sponsor pressure: Partners ask for performance evidence beyond reach and impressions.
    • Offer changes: Your descriptions and calls to action change often across the catalog.
    • Multiple channels: Separate licenses and separate dashboards create management friction.
    • Operational overload: Repetitive updates take time away from production and sales.

    This week, audit one channel and write down the exact task slowing you down. If it's metadata maintenance, test the lowest TubeBuddy tier that supports it. If it's revenue attribution, build trackable links and connect them to the videos promoting your offer. Don't upgrade because a competitor's feature list looks impressive. Upgrade when your workflow has a measurable gap.


    ViewsMax helps creators connect content to clicks, leads, and sales through trackable links, publishing workflows, and performance reporting. If TubeBuddy shows you how to optimize a video, ViewsMax helps you evaluate whether that content is producing business results.

  • Is YouTube Profitable for Creators in 2026

    Is YouTube Profitable for Creators in 2026

    YouTube generated more than $60 billion in revenue in 2025, but an individual creator is profitable only when the business earns beyond advertising and tracks which content produces off-platform conversions. The platform is massively profitable. Your channel may not be.

    The popular advice is to chase views, increase subscribers, and wait for AdSense to make the work worthwhile. That advice confuses attention with profit. A video can attract a large audience and still lose money after production costs, taxes, and unpaid labor. Another video with a smaller audience can generate leads, affiliate commissions, sponsorship revenue, or product sales that make the channel financially sustainable.

    The right question isn't just “How much does YouTube pay per view?” Ask instead: Which formats attract valuable viewers, which offers convert them, and what remains after every cost?

    The Profitability Gap Between Platform and Creator

    YouTube is profitable at a corporate scale. That doesn't mean every channel is profitable at the creator level.

    Alphabet reported that YouTube's advertising and subscription revenue exceeded $60 billion for full-year 2025, while Alphabet's total annual revenue reached $403 billion, up 15% year over year. The company also reported more than 325 million paid subscriptions across consumer services, led by Google One and YouTube Premium. YouTube's combined revenue even exceeded Netflix's $45.18 billion in 2025 revenue, according to the company's earnings disclosure filed with the U.S. Securities and Exchange Commission.

    That scale proves the platform has a durable commercial engine. It doesn't prove that your upload schedule has a healthy margin.

    Views don't equal business income

    Recent creator-economy reporting places the median long-form creator's earnings at about $2.30 per 1,000 views, while also describing a highly concentrated payout environment in which top channels capture outsized shares of advertising income. The creator payment analysis from Gigapay also notes that the top tier can earn substantial annual advertising income and receive a disproportionate share of brand-campaign revenue.

    That median figure isn't a promise or a universal rate. It illustrates the central problem: a channel can collect views without producing enough cash to pay its owner fairly. Geography, audience demand, subject matter, viewer intent, ad suitability, seasonality, and format all affect the result.

    Subscriber count is an especially weak profitability metric. Subscribers can help distribution, but they don't automatically buy anything, click an affiliate link, join a membership, or hire you. A smaller audience with a clear commercial problem can be worth more than a broad audience that watches passively.

    Practical rule: Treat every video as either an audience asset, a sales asset, or both. If it does neither, question why you're producing it.

    Think like a media company

    A serious channel needs more than a content calendar. It needs a revenue model, a cost structure, an editorial position, and a way to measure return on effort.

    That means tracking:

    • Revenue by source: Advertising, sponsorships, affiliates, memberships, services, and products.
    • Revenue by video: Identify which topics and formats generate money, not just watch time.
    • Production cost: Include editing, research, thumbnails, software, equipment, and your own labor.
    • Conversion quality: Measure leads, sales, calls booked, or subscriptions produced by viewers.
    • Format contribution: Separate long-form performance from Shorts performance instead of blending them into one channel average.

    The platform's success gives creators access to a large monetization ecosystem. It doesn't remove the need for business discipline. If your only revenue line is AdSense, you're operating one part of a media business and calling it the whole company.

    How YouTube Generates and Distributes Revenue

    YouTube's money flows through several systems, and each system changes the creator's effective economics.

    Long-form advertising uses a 55% creator and 45% platform revenue split for ad revenue, according to YouTube's official Partner Program guidance. Shorts uses a different pooled model, so a creator's effective share and revenue per view generally differ from long-form results.

    An infographic showing how YouTube generates revenue through traditional advertisements and other diversified income streams for creators.

    Long-form and Shorts are different businesses

    Long-form videos can carry advertising around the viewing experience and, when eligible, within longer content. That creates more opportunities to monetize a viewer session. The format also gives creators more room to explain a problem, establish trust, compare products, and direct viewers toward an offer.

    Shorts can deliver discovery and reach, but its pooled revenue structure makes the economics different. A channel that evaluates Shorts only by raw view count may overestimate their direct financial contribution. Shorts can still be valuable when they introduce the right audience to long-form content, an email list, a product, or a service.

    The strategic decision isn't “long-form or Shorts.” Use each format for the job it performs best:

    • Long-form: Build authority, capture search intent, support deeper sponsorships, and drive conversions.
    • Shorts: Test hooks, reach new viewers, create repeated exposure, and route attention toward stronger revenue assets.
    • Live content: Encourage direct participation through fan funding and community interaction.
    • Channel ecosystem: Turn individual videos into a sequence that moves viewers from discovery to trust to action.

    CPM isn't your paycheck

    CPM describes what advertisers pay for ad impressions. RPM is closer to the creator's realized revenue per thousand views, because it reflects what the channel receives across monetized and unmonetized views after YouTube's share and other delivery conditions.

    Audience geography matters because advertiser demand differs between markets. Niche matters because a viewer researching a business tool or financial product may carry different commercial value from a viewer consuming broad entertainment. Advertiser suitability matters because restricted inventory can reduce monetization opportunities.

    You can review a practical explanation of the metric in this guide to what CPM means on YouTube. Use it as a measurement starting point, not as a forecast.

    YouTube's overall financial scale reinforces the ecosystem's durability. Alphabet reported YouTube advertising revenue of $8.1 billion in Q1 2024, $8.66 billion in Q2, $8.92 billion in Q3, and $10.47 billion in Q4, with Q4 advertising revenue up 13.8% year over year. Full-year 2024 advertising revenue reached about $36.15 billion, up 14.7% from the prior year, and combined advertising and subscription revenue surpassed $50 billion over the preceding four quarters by late 2024, as reported by Variety's coverage of Alphabet's earnings.

    That growth supports infrastructure and creator payouts, but it doesn't guarantee an individual channel a living wage. Your format mix still determines how efficiently attention becomes revenue.

    YouTube also reported more than $60 billion in total revenue in 2025, with approximately $40.4 billion from advertising, according to BBC reporting on the company's results. The remainder came from subscriptions and other monetization, which matters because the platform isn't dependent on advertising alone. Creators shouldn't be either.

    Calculating Your True Margins and Hidden Costs

    Gross revenue is not profit. Your YouTube Studio dashboard shows money entering the business, not what you keep after production, taxes, and the value of your time.

    Start with a simple monthly profit and loss statement. Record every revenue source, then subtract direct production expenses, overhead, taxes, and a reasonable labor cost for your own work. If the result is negative, increasing the upload frequency may enlarge the loss rather than solve it.

    Build the calculation from the bottom up

    Use this sequence:

    1. Record realized revenue. Use the amount credited or received, not an advertiser's CPM estimate.
    2. Separate revenue streams. Keep advertising, sponsorships, affiliates, memberships, and products in distinct lines.
    3. Assign production costs. Include editors, writers, thumbnail designers, music licenses, props, travel, software, and payment processing.
    4. Allocate shared overhead. Studio rent, cameras, computers, lighting, internet, and subscriptions support multiple videos, so assign a reasonable portion to the channel.
    5. Value your labor. Count scripting, filming, editing, publishing, sales, community management, and administration.
    6. Reserve for taxes. Self-employment and income-tax obligations vary by location and structure, so obtain professional advice instead of treating pre-tax cash as take-home pay.

    Equipment also loses value over time. A camera purchased for the channel isn't free because you paid for it once. Treat major purchases as business assets and allocate their cost across the period in which they support production.

    A working margin template

    The brief provides no verified percentages for individual creator cost categories, so don't pretend a universal split exists. Use your own records and replace the blank assumptions with actual amounts.

    Revenue / Cost Category Percentage of Gross Ad Revenue Impact on Bottom Line
    Gross advertising revenue 100% Starting point, not profit
    YouTube platform share Not applicable to creator-reported revenue Already reflected according to the revenue measure you use
    Editing and post-production Calculate from invoices or hours Reduces contribution margin
    Research, scripting, and production labor Calculate from tracked time Reveals whether the channel pays you fairly
    Software, music, and subscriptions Calculate monthly allocation Creates recurring overhead
    Equipment and studio allocation Calculate depreciation or usage allocation Prevents one-time purchases from hiding ongoing cost
    Taxes and professional fees Calculate for your jurisdiction Reduces cash available for personal income
    Net channel profit Calculate after all costs The number that determines sustainability

    Don't mix CPM with profit, and don't use subscriber count as a revenue forecast. A useful guide to how much a YouTuber makes per subscriber can help explain why subscriber totals alone don't establish income.

    A profitable upload schedule is one that pays for production, compensates the creator, and leaves cash to reinvest.

    Diversifying Income Beyond the AdSense Dashboard

    Advertising is useful, but it gives you limited control. Advertisers, viewer behavior, platform policies, and market conditions influence the amount you receive. A channel becomes sturdier when it owns additional paths from viewer interest to revenue.

    YouTube itself reported that it paid creators, artists, and media companies more than $100 billion over the four years ending in 2025, while its 2025 revenue exceeded $60 billion. The creator-economy data overview from Digital Applied emphasizes the practical implication for creators: platform economics include advertising, subscriptions, format-specific revenue sharing, and fan funding, not just CPM.

    Compare the revenue options

    Sponsorships can move the needle when your audience matches a brand's buying market. Sponsors care about relevance, trust, placement, and business outcomes, not only your public subscriber number. Build a concise media kit with audience characteristics, average performance by format, prior campaign results if available, and a clear deliverable list.

    Affiliate marketing works best when your videos already answer purchase-intent questions. Reviews, comparisons, tutorials, and setup guides can naturally support tracked product links. The creator earns when a viewer completes the required action, so the offer and audience fit matter more than broad reach.

    Memberships and fan funding suit channels with recurring community value. Behind-the-scenes material, direct interaction, exclusive streams, or member-led access can support recurring income, but only if you can deliver consistently without turning the channel into an exhausting service obligation.

    Digital products, courses, and services offer the most control because you own the offer and the customer relationship. They also carry more responsibility. The product must solve a real problem, support quality delivery, and justify its price. A tutorial channel might sell a structured course, while a business channel might generate consulting leads or sell templates.

    Merchandise fits identity-led communities better than purely informational channels. It can strengthen the brand, but inventory, fulfillment, returns, and customer support can destroy margins if you treat sales volume as profit.

    A useful framework is to assign each revenue source a job:

    • Advertising funds attention: It monetizes existing viewing activity.
    • Affiliates monetize recommendations: They convert commercial intent without requiring you to build the product.
    • Sponsors monetize trust: They connect a relevant brand to an audience that listens.
    • Products monetize expertise: They turn your knowledge into an owned offer.
    • Services monetize access: They produce revenue from a smaller number of high-value customers.

    Don't add every option at once. Choose the stream that matches viewer intent, then measure whether it produces profit after fulfillment and support.

    Your channel should lead viewers somewhere useful. This guide to earning money from a YouTube channel provides broader context on combining YouTube monetization with other income sources.

    The strongest mix usually contains a discovery format, a trust-building format, and a conversion path. That structure reduces dependence on any single algorithmic or advertising outcome.

    Tracking Attribution to Prove What Actually Sells

    Most creators know which videos get views. Far fewer know which videos produce revenue.

    Watch time helps you understand audience behavior, but it doesn't answer the commercial question. A high-retention video may create awareness without generating a lead. A modest tutorial may send qualified buyers to a checkout page for months. If you don't connect content to outcomes, you can't tell the difference.

    Give every conversion path a source

    Create a distinct trackable link for each important video or campaign. Place it in the description, pinned comment, channel profile, or relevant community post, then connect the destination to your lead form, booking system, affiliate page, or checkout process.

    A practical workflow looks like this:

    1. Define the conversion: Sale, qualified lead, booked call, email signup, affiliate action, or membership.
    2. Create a unique link: Use a separate link for each video so clicks carry a content identifier.
    3. Use consistent naming: Include the topic, format, and publishing date in your internal campaign label.
    4. Place the link deliberately: Put the primary action near the top of the description and repeat it in a natural spoken call to action.
    5. Record downstream results: Capture clicks, leads, sales, refunds, and revenue rather than stopping at visits.
    6. Review by content: Compare revenue per video, conversion rate, and profit after content cost.

    Screenshot from https://blog.viewsmax.com

    ViewsMax is one option for creating trackable links, monitoring clicks, and connecting leads or sales to the content that generated them. The important principle isn't the dashboard itself. It's the discipline of assigning a source to every meaningful conversion.

    Choose an attribution model consciously

    A viewer may discover you through a Short, watch a long-form tutorial later, click a link from a pinned comment, and purchase after returning through email. Last-click attribution would credit the final interaction. A first-touch model would credit discovery. A multi-touch model would distribute credit across the journey.

    For creators with several content formats or sales channels, Otter A/B attribution modeling offers useful background on how different attribution approaches assign credit. You don't need an elaborate analytics department to begin. Start with first-touch and last-touch reporting, then add a simple assisted-conversion view once your volume justifies it.

    Measurement principle: The video with the most views isn't automatically your best business asset. The best asset is the one that creates profitable outcomes at a sustainable production cost.

    Review the data on a fixed schedule. Identify videos that produce clicks but few sales, sales without strong view counts, and high revenue with excessive production time. Then make decisions based on contribution margin, not applause.

    Building a Sustainable and Profitable Channel Strategy

    Profitability requires a channel strategy that protects cash, attention, and creative capacity. The goal isn't to publish as much as possible. The goal is to build a repeatable system in which each format supports a defined business outcome.

    Start with a narrow audience and a clear promise. A specific viewer should understand what problem you solve and why your perspective is useful. Broad topics can attract attention, but focused positioning makes sponsorships, products, affiliates, and services easier to match with the audience.

    Make the format mix earn its place

    Give every format a responsibility:

    • Long-form should build trust and commercial context. Use it for tutorials, comparisons, analysis, and stories that help viewers make decisions.
    • Shorts should support discovery or testing. Keep the strongest hooks, then guide interested viewers toward deeper content or a relevant offer.
    • Live sessions should deepen participation. Use them when real-time access creates more value than a scripted upload.
    • Email and owned channels should preserve the relationship. YouTube can introduce the audience, but an owned list gives you a direct path to future offers.

    Avoid viral chasing when the traffic has no connection to your niche or product. A trend can produce impressive surface metrics while attracting viewers who never return and never convert. Evergreen content with clear buyer intent often creates a more useful asset, even when it grows less dramatically.

    Audit the business, not just the channel

    Review these questions regularly:

    1. Which videos produced revenue, leads, or qualified conversations?
    2. Which topics attracted viewers who took action?
    3. Which uploads consumed the most time relative to their return?
    4. Does each major offer have a trackable content path?
    5. Can the business withstand a weak advertising period?
    6. Are you paying yourself for production and management work?
    7. Which tasks should remain in-house, and which should move to an editor or specialist?

    Use AI tools carefully to improve production efficiency, not to flood the channel with repetitive material. Creators exploring automated workflows can review resources for AI video ads, then apply human judgment to scripting, claims, editing, and audience fit.

    Your final decision rule should be blunt: keep producing a format when it creates durable audience value or profitable revenue, improve it when attribution shows potential, and stop it when the numbers remain weak after a fair test. YouTube is profitable for the platform because it combines advertising, subscriptions, and a global distribution system. Independent creators become profitable when they build a similar discipline at a smaller scale, with diversified revenue, controlled costs, and evidence connecting content to sales.


    ViewsMax helps creators create trackable links, connect clicks and sales to individual videos, and manage content planning and publishing around real offers. Visit ViewsMax to start measuring which YouTube content drives revenue, then use that evidence to invest in the formats and topics that grow your business.

  • YouTube Like Count: What It Means and How Creators Earn It

    YouTube Like Count: What It Means and How Creators Earn It

    You can watch a video collect thousands of likes and still have no idea whether it helped your channel, your audience, or your business. That's the gap behind the YouTube like count. The number is easy to see, but its meaning depends on what viewers did before the click, what they did afterward, and whether the interaction survived YouTube's filtering and reporting systems.

    A like is useful evidence, not a verdict. Treat it as a surface-level sign of approval, then compare it with retention, returning viewers, clicks, subscriptions, and revenue before deciding that a video connected.

    What the YouTube Like Count Really Represents

    A creator opens a video and notices that the visible count has changed. Sometimes it rises slowly, sometimes it appears to lag, and sometimes the expected number seems to have vanished from a familiar part of the interface. That experience can make the count feel like a direct audience reading, but it's better understood as a public-facing aggregate of one viewer action.

    A viewer presses the thumbs-up button. YouTube records that action against the relevant video and viewer account, then combines eligible interactions into the number shown on the public watch page. The count doesn't reveal which viewers liked the video, why they did it, or what happened during the rest of the viewing session.

    It also doesn't expose every piece of sentiment. Public dislike counts are no longer available, while creator-side dislike metrics remain accessible in Studio, creating a separation between what viewers can audit and what the creator can analyze internally. CNET's reporting on YouTube's public dislike change describes this asymmetry between public engagement signals and creator analytics.

    The action behind the number

    A like can mean several things:

    • Approval: The viewer enjoyed the video or agreed with its point.
    • Utility: The viewer found the tutorial, review, or explanation useful.
    • Support: The viewer wants to encourage the creator.
    • Participation: The viewer responded to a prompt or community habit.
    • Low-friction feedback: The viewer wanted to react without leaving a comment.

    Those meanings aren't interchangeable. A tutorial may earn likes because it solved a specific problem. A dramatic opinion video may earn likes because viewers agree with its framing. A short entertainment clip may receive a quick reaction without creating much lasting interest.

    That's why a like count shouldn't be read as a complete measure of satisfaction, loyalty, or buying intent. It tells you that eligible viewers selected the thumbs-up action. It doesn't tell you whether they watched to the end, returned for another upload, clicked a product link, or recommended the video privately.

    Practical rule: Use the public count to observe audience response, not to diagnose the entire audience experience.

    For a more structured way to compare likes with views and other interactions, use a YouTube engagement rate calculator. The important habit is to interpret the ratio alongside the underlying behavior, rather than treating the visible total as the result you're trying to maximize.

    How YouTube Records and Displays Likes

    A like moves through several surfaces before you see it in a dashboard. Understanding that path makes discrepancies less alarming.

    First, a viewer selects the thumbs-up control on the watch page. The same basic action can happen through a mobile gesture, a connected television interface, or another supported YouTube experience. The platform then processes the event and updates the relevant video-level aggregate.

    Second, YouTube reconciles the event with account status, platform rules, and filtering systems. A visible counter isn't necessarily an immutable ledger. YouTube may remove ineligible interactions, update totals after processing, or display information differently across public and creator-facing surfaces.

    Third, creators encounter the result in Studio. Studio can expose broader analytics than the public watch page, including creator-side dislike information and other performance details. Public viewers, by contrast, can directly inspect the like total but can't inspect the corresponding dislike total.

    The YouTube Data API v3 is another reporting surface. Developers can use YouTube's official API documentation and connected tools to request video statistics, but a third-party display may not refresh at the same moment as the watch page or Studio. A tool can also apply its own caching or reporting schedule.

    An infographic illustrating the four-step process of how YouTube records and displays video like counts.

    Why totals can disagree

    Creators usually notice differences for practical reasons:

    • Processing delay: One surface may update before another.
    • Filtering: YouTube can remove activity that doesn't qualify.
    • Interface changes: Studio can relocate or hide a familiar column.
    • Tool timing: An API client or external dashboard may use cached data.
    • Public versus private analytics: The watch page and Studio don't expose identical fields.

    The platform's product surfaces have changed repeatedly. YouTube publicly tested removing the visible dislike count in 2021, while the like and dislike history remained available through account activity views rather than being fully deleted, as documented in coverage of the 2021 YouTube engagement-count change.

    By 2026, the like count was still a moving Studio interface element. Reporting noted that the Likes column began disappearing from the Content page around mid-to-late May 2026, with creator complaints peaking in late June 2026. That doesn't mean likes stopped being recorded. It means the place where creators saw the value continued to change, as described in reporting on the YouTube Studio Likes column.

    If you're comparing channel performance, also separate likes from views. A YouTube views calculation guide can help clarify why view reporting and engagement reporting shouldn't be treated as one identical counter. Creators evaluating channel income may also find a Forexyoutube monetization tool useful for putting monetization questions beside, rather than inside, the like metric.

    Why the Public Like Count Is Only One Signal

    The visible count answers a narrow question: how many eligible viewers selected thumbs up? It doesn't answer whether YouTube should recommend the video more widely, whether viewers found the opening compelling, or whether the content created value after the session ended.

    YouTube's own help guidance frames likes as one engagement signal among views, subscriptions, and other interactions, rather than a standalone growth engine. YouTube's creator documentation on analytics and engagement is useful because it places likes inside a broader measurement system.

    The deeper signals behind performance

    A strong like response can coexist with weak retention. A controversial title can attract viewers who react quickly, then leave before the main explanation. A practical tutorial can receive fewer visible likes while keeping viewers engaged, earning returning viewers, and generating useful clicks.

    Read the signals together:

    Metric Where It Appears Role in Recommendation System What Movement Tells Creators
    Public likes Watch page and selected Studio surfaces Supporting sentiment signal Viewers found a reason to approve or support the video
    Retention YouTube Studio Analytics Shows whether the video holds attention The script, pacing, and payoff are working or failing
    Watch time and viewing behavior YouTube Studio Analytics Helps describe session quality Viewers spend meaningful time with the content
    Click-through rate YouTube Studio Analytics Connects impressions with viewing decisions Packaging attracts or fails to attract the intended audience
    Shares, subscriptions, and return visits Studio and audience reports Shows deeper audience response The video may have created a relationship beyond a single reaction

    This is why a high like-to-view ratio can mislead. A small but enthusiastic audience may like nearly everything, while a broader audience may watch carefully without pressing the button. Neither pattern proves success by itself.

    A better interpretation framework has three questions. Did the viewer stay for the promised value? Did the viewer take a useful next action? Did the video attract the audience the channel wants to serve?

    A public like count is visible feedback. Retention and downstream behavior explain whether that feedback matters.

    Use the count as a diagnostic clue. If likes rise while retention falls, inspect the opening and packaging. If likes remain modest but returning viewers, subscriptions, or qualified clicks improve, don't dismiss the video. For a wider look at how multiple signals combine into breakout performance, explore what makes a YouTube video go viral.

    Practical Tactics Creators Use to Earn Meaningful Likes

    Meaningful likes usually follow a clear exchange. The viewer receives a useful idea, an emotional payoff, a solution, or a memorable experience, then chooses to signal approval. Asking for a like can help, but the request works best when the video has already earned the response.

    An infographic titled Practical Tactics for Earning Meaningful Likes, illustrating three steps to improve engagement through effective content.

    Start with the promise viewers can recognize

    Your thumbnail should make the payoff legible. Use a face when human reaction matters, strong contrast when the subject needs to stand out, and an emotion cue that matches what the video delivers. A dramatic expression attached to a calm educational explanation can win the click but weaken trust once the viewer starts watching.

    The title and thumbnail should form one promise, not two competing ones. If the title promises a fix for a specific problem, the opening should confirm that problem quickly and establish why the viewer should continue.

    Build the like into the value exchange

    A natural prompt connects the action to the viewer's experience:

    • After a useful solution: “If this fixed the issue, tap like so I know this format helped.”
    • After a clear comparison: “If the distinction is useful, leave a like before we test the next option.”
    • Before a transition: “If you're getting value from this breakdown, a like helps other viewers find it.”

    These prompts work because they give the viewer a reason. Avoid repeating the request so often that it interrupts the lesson, story, or review.
    The strongest moment may come after the first confirmed payoff, not immediately after the greeting. Viewers haven't received enough value at the start to make the request feel earned.

    Use the surrounding channel experience

    A pinned comment can extend the conversation with a focused question. Ask viewers to identify the part they'll apply, choose between two options, or describe the problem that brought them to the video. That creates a reason to comment without turning the video into an engagement contest.

    Community posts can prepare an audience before a premiere or upload. Share the problem, an early question, or a small decision point, then make the full video the place where viewers receive the complete answer.

    Playlists, chapters, cards, and end screens can guide interested viewers toward the next relevant piece of content. They don't manufacture a like, but they can help viewers continue through a coherent topic sequence. That additional context gives the original video a better chance of being remembered and appreciated.

    Know when restraint is the better tactic

    A direct prompt isn't suitable for every subject. Sensitive news, personal disclosures, grief-related material, or artistic shorts can lose credibility when the creator inserts a cheerful request at the wrong moment.

    YouTube has publicly discouraged engagement-bait patterns, so don't offer artificial rewards, pressure viewers to click repeatedly, or frame the like as a test of loyalty. Make the request optional, specific, and subordinate to the content.

    The aim isn't to make every viewer press a button. It's to create a video where the button feels like a reasonable response to the value delivered.

    Reading Likes Against Revenue and Attribution

    A public like can show appreciation, but it can't settle a revenue question. Revenue depends on the audience reached, the viewing experience, monetization conditions, offers presented, and the actions people take after watching.

    Creators should read the like-to-view relationship beside average view duration, retention, click-through rate, subscriber conversion, RPM, and attribution events. These metrics answer different questions. Likes describe a reaction. Retention describes attention. Attribution connects content with a measurable business outcome.

    The signals that matter after the reaction

    A video can attract enthusiastic approval but send few people toward an offer. Another can generate quieter engagement while introducing qualified viewers to a service, course, product, or consultation.

    Signal What It Measures Revenue Connection
    Public likes Visible approval from eligible viewers Indicates sentiment, but doesn't identify buyers
    Average view duration How long viewers stay Helps show whether the content holds attention around the offer
    Retention Where viewers continue or leave Reveals whether the explanation reaches its important moments
    RPM and ad performance Monetization associated with viewing Connects audience activity with advertising revenue
    Clicks, leads, and sales Actions after exposure Shows whether content contributes to commercial results

    Don't use invented benchmarks to judge one video against another. Instead, compare videos within your own channel and ask whether the audience behavior matches the business goal.

    For example, a video designed to sell a service should have a clear path from explanation to action. Use trackable links in the description, pinned comment, or relevant post, then compare the resulting clicks and conversions with the visible reaction. A thumbs-up can't tell you which viewer became a lead, but attribution can connect the content to that journey.

    Creators who want a practical walkthrough can read YouTube Studio metrics before building a reporting routine. Studio provides the behavioral context needed to avoid making decisions from the loudest number on the page.

    Decision filter: Keep likes in the report, but let retention, qualified clicks, subscriptions, and attributed revenue decide what you publish next.

    A useful weighting approach is simple. First, confirm that the video reached the intended audience. Next, inspect whether viewers stayed for the core promise. Then review the actions that support the channel's objective. Finally, use likes to understand sentiment and identify topics viewers openly appreciated.

    Troubleshooting Sudden Drops and Discrepancies

    A falling like count feels personal because creators often watch it as a live audience verdict. It isn't always one. YouTube can reconcile activity after the initial display, and different reporting surfaces can show different stages of that reconciliation.

    Start by separating a count problem from an audience problem. If the like number changed but retention, comments, returning viewers, and traffic sources look stable, the count may reflect filtering, delayed processing, or an interface difference rather than a sudden change in audience opinion.

    A calm diagnostic sequence

    Use this order before changing the title, deleting the video, or publishing an apology:

    1. Check the same video in multiple surfaces. Compare the public watch page with Studio and any legitimate API-based reporting tool you already use.
    2. Look for platform notices. Review Studio messages and removal reports for signs that YouTube has invalidated activity.
    3. Inspect behavior, not just reactions. Check retention, traffic sources, and returning viewers for a matching movement.
    4. Allow processing time. A temporary discrepancy can resolve after YouTube finishes updating its systems.
    5. Record the change. Save the date, surface, and displayed value so you can identify a recurring reporting pattern.

    Don't assume the Data API and watch page must return an identical value at every moment. They can update on different schedules, and an external dashboard may add another delay.

    When the shift may reflect a real problem

    A genuine audience reaction often leaves more than one trace. If a controversial statement appears at a specific timestamp, retention may dip there and comments may become more critical. If a title or thumbnail changes, click-through rate may move while the content itself remains unchanged.

    A recommendation loop can also bring a video to viewers who aren't a good fit. In that case, the count may grow while retention weakens, or negative feedback may become more visible in comments and audience reports.

    Avoid reacting to one number in isolation. Compare the timing of the like movement with publishing changes, packaging edits, traffic-source changes, and audience behavior. If the public count is the only metric that moved, investigate reporting first. If several signals changed together, review the content and distribution strategy.

    Creator Checklist and What Comes Next

    Run this checklist before publishing and during the first monitoring window:

    1. Audit the thumbnail: Confirm that the visual cue matches the actual payoff.
    2. Script the value hook: State the problem and intended result early.
    3. Time the CTA naturally: Ask for a like after a useful moment, not before the viewer has context.
    4. Engage early viewers: Reply to comments and look for repeated questions.
    5. Respond with substance: Use comments to identify confusion, appreciation, and objections.
    6. Cross-promote selectively: Send the video to audiences that need its subject.
    7. Monitor live signals: Compare likes with retention, traffic sources, and viewing behavior.
    8. Test packaging carefully: Change titles or thumbnails only when you have a clear reason.
    9. Review end screens: Guide satisfied viewers toward the next relevant video.
    10. Analyze the early data: Compare the initial response with later audience quality instead of chasing a single count.

    A creator checklist infographic featuring ten numbered steps for optimizing YouTube video performance and future engagement.

    What may change next

    The public presentation of engagement is likely to remain flexible through 2026. YouTube has already changed how dislike information appears publicly, and Studio has continued reorganizing where creators find like data. Future interface changes could alter visibility or presentation again, but that possibility shouldn't change the core measurement habit.

    YouTube has also updated public view-count language to emphasize engaged views in Analytics, reinforcing the difference between visible surface counts and the metrics creators use internally. The practical implication is clear. Build reporting around behavior and outcomes, then use the public like count as supporting context.

    Don't buy likes. Artificial activity may inflate the visible number while weakening the reliability of your reports and giving you no trustworthy evidence about audience satisfaction or commercial intent.

    A public like count is most valuable when it reflects audience respect, not when it becomes the goal itself.


    ViewsMax helps creators connect content with measurable business actions by creating trackable links and showing clicks, leads, and attributed sales alongside content performance. If you want to move beyond counting likes and identify which videos contribute to revenue, visit ViewsMax and build your attribution workflow around the audience actions that matter.

  • Live View Count Explained and How to Grow It

    Live View Count Explained and How to Grow It

    You start a live stream with a clear topic, a prepared offer, and a notification sent to your audience. The counter climbs, your excitement rises, and then the number stalls. Later, the public replay shows a different total, while the creator dashboard reports another set of figures. You're left asking the wrong question: “Which live view count is correct?”

    The better question is, what did those viewers do after they entered? Did they stay, participate, click your offer, book a call, or buy? A raw count can tell you that activity occurred, but it can't tell you whether the audience paid meaningful attention or produced business value.

    Why Your Live View Count Tells Only Half the Story

    A live view count feels easy to understand because it appears as one visible number. During a broadcast, though, that number can represent different kinds of activity depending on the platform, the dashboard, and the point in time when you check it.

    Consider a creator hosting a product demonstration. The counter rises quickly when the stream begins, reaches a peak during the main reveal, and then falls as people leave. The creator may interpret the decline as failure, even though the viewers who stayed could have generated more qualified interest than a much larger audience that watched briefly and disappeared.

    The number is useful, but it's only one layer of the story. YouTube separates total live views from concurrent-viewer information, and its analytics system makes those distinctions visible in Studio shortly after a stream ends. YouTube's live analytics documentation describes concurrent viewers as the maximum number watching at one time, while views represent the total times the stream was viewed while live.

    The counter changes meaning with context

    A total live view figure answers a reach question: how much viewing activity did the broadcast attract while it was live? Concurrent viewers answer a presence question: how many people were watching at the same moment? Peak concurrent viewers answer a momentum question: what was the largest simultaneous audience?

    None of those figures directly answers an outcome question. They don't show whether viewers understood the offer, trusted the presenter, clicked a link, submitted a lead, or purchased.

    That's why creators who chase the highest possible number often make poor programming decisions. They may shorten a valuable explanation, create unnecessary controversy, or use a dramatic opening that attracts brief visits but fails to hold attention. A stream can produce an impressive spike and still perform weakly as a sales channel.

    Practical rule: Treat the live view count as a starting signal, not a verdict on content quality.

    The rest of the analysis should connect audience activity to behavior. Look for the moments that hold viewers, prompt questions, and generate clicks. A smaller but attentive audience can be more commercially useful than a larger crowd that never moves beyond the player.

    The distinction also matters when you stream across several platforms. A figure reported by one service may reflect a player load, while another platform may define its total as views accumulated during the live session. Before comparing results, you need to know what each platform counts.

    What Live View Count Actually Measures

    The phrase live view count often bundles several metrics together. Separating them makes the numbers much easier to interpret.

    Think of a physical event held in a room. Concurrent viewers are the people inside at a particular moment. Peak concurrent viewers are the largest crowd present at any one time. Total live views are the accumulated entries recorded throughout the event, including people who arrived, left, and returned.

    YouTube's terminology follows this logic. Its documentation defines concurrent viewers as the maximum number of viewers watching a live stream at one time and defines views as the total number of times the stream was viewed while live. YouTube also makes live analytics available in Studio, with concurrent-viewer reporting available at the video level within minutes after the broadcast ends. YouTube's explanation of live-stream metrics is the right reference when you're interpreting a YouTube broadcast.

    A diagram explaining the differences between concurrent viewers, total views, and unique viewers for live content.

    Three numbers, three questions

    Concurrent viewers tell you about the audience watching together. This is valuable for events built around shared timing, such as launches, interviews, live coaching, or breaking commentary. A strong concurrent audience can also make chat feel active, which may encourage other viewers to participate.

    Peak concurrent viewers show the highest simultaneous audience reached during the stream. Use this metric to locate moments of concentrated interest. If the peak occurred during a demonstration, audience questions, or an offer explanation, that moment deserves closer review.

    Total live views measure accumulated viewing activity while the stream is live. They don't necessarily represent unique people. One person can enter more than once, and a viewer who leaves early may contribute to the total without contributing much watch time.

    The term unique viewers needs separate treatment. It refers to distinct users who watched at least once, whereas total views count viewing events under the platform's definition. The two figures can therefore tell very different stories. A high total paired with a much smaller unique audience may indicate repeat visits or multiple sessions, not broad reach.

    Use the right metric for the decision

    Match the metric to the decision you're making:

    • Planning a shared event: Review concurrent and peak concurrent viewers.
    • Evaluating reach: Review total live views and unique-viewer information where available.
    • Improving content: Study retention, average watch time, chat activity, and engaged viewing.
    • Measuring revenue: Track clicks, leads, bookings, and sales from the stream.

    A storefront analogy helps here. A counter outside the shop can record people passing the entrance, while an indoor counter records people who enter. Neither tells you who examined a product or made a purchase. The live view count works the same way. It records an important stage in the audience journey, but it doesn't replace behavioral or conversion data.

    How Major Platforms Count Live Views Differently

    A creator simulcasts the same product demo on YouTube and Vimeo. Both dashboards show a similar live view count, yet one figure may represent player loads while the other represents views recorded during the broadcast. Treating those totals as interchangeable can make a campaign look stronger or weaker than it is, especially when the goal is clicks, leads, or sales.

    Each platform defines and displays live metrics through its own reporting system. Record the platform and metric name before comparing results. A view may be triggered by a player loading, playback beginning, or a viewer entering the live broadcast. The reporting screen may also refresh separately from the underlying event data.

    Vimeo, for example, defines total views as player loads and reports current viewers, peak viewers, and average time watched separately. YouTube defines live views as the total number of times a live stream was viewed while live. Vimeo's live analytics guide and YouTube's view calculation process provide platform-specific context for interpreting those figures.

    Live View Count Comparison Across Platforms

    Platform What Triggers a View Concurrent Metric Refresh Behavior
    YouTube Views represent the total times the stream was viewed while live. YouTube's public view rule also counts playback from the first frame. Concurrent viewers and peak concurrent viewers are reported separately. Public counters and analytics displays can update at different times.
    Vimeo Total views are defined as player loads. Current viewers and peak viewers are reported separately, along with average time watched. The dashboard presents separate live and total-view fields.
    Twitch Interpret the view figure through the metric label shown in Twitch's dashboard rather than assuming it matches another platform. Use the platform's concurrent-audience reporting for simultaneous viewers. Timing can vary between live interfaces and later analytics.
    Facebook Read live reporting through Facebook's own labels and definitions. Treat simultaneous viewers as distinct from accumulated views. Public and internal reporting may update at different moments.

    The cautious wording matters. Where a platform's supplied definition does not establish a precise trigger, do not fill the gap with an assumption. For a client report, record the platform, stream, metric name, reporting location, and capture point.

    Don't build reports from raw totals alone

    Place each figure beside its definition. Compare average time watched with average time watched, or peak concurrent viewers with peak concurrent viewers, when both platforms provide comparable fields. Player loads and live-session views describe different stages of the audience journey.

    Then connect viewing activity to business behavior. A large accumulated total may show that a player loaded repeatedly, while clicks reveal whether viewers responded to the offer. Leads and sales show whether that attention produced revenue.

    A reliable cross-platform report should answer four questions:

    1. Which platform produced the figure?
    2. What triggered the recorded view?
    3. Is the number cumulative, simultaneous, or unique?
    4. Was it captured during the stream or after processing?

    Without those labels, stakeholders can compare different measurements while believing they are reviewing the same KPI.

    Why Live View Counts Fluctuate and Discrepancies Appear

    Your stream can attract a surge of clicks while the public counter still shows yesterday's picture. A live count is a moving signal, not a perfectly synchronized record, so it may rise, pause, fall, or differ from the creator dashboard without indicating a technical problem.

    External counters usually refresh on a short cycle. That delay separates activity inside the platform from the number shown on a public page. During a sudden audience surge, new sessions may already be processed while the visible counter still reflects an earlier state. YouTube's live metrics reference distinguishes total live views from the instantaneous audience watching at a given moment.

    An infographic explaining why live view counts fluctuate and showing common causes for discrepancies on streaming platforms.

    Four normal causes of movement

    Audience turnover explains much of the movement. Viewers may join for the opening, leave when the subject changes, and return for a later segment. Accumulated views can keep increasing while concurrent viewers decline, much like a shop's daily visitor total can rise even as the number inside falls.

    Dashboard timing creates another difference. A public page may refresh on one schedule, while Studio or an internal analytics panel processes events through another. The figures can align later without either display being incorrect.

    Playback behavior also affects the total. YouTube's public-view rule counts a view for long-form videos, live streams, and podcasts when playback begins or when a viewer enters the live broadcast, without a minimum watch-duration requirement for that public count. The change took effect globally on August 24, 2026, according to YouTube's public-view update.

    Embeds and repeated sessions add further variation. A stream embedded on a website can attract viewers who are less visible in the platform's main community. Refreshing a page, changing devices, or re-entering the broadcast may create additional sessions under the platform's rules.

    Separate signal from noise

    A single drop is weak evidence. Compare concurrent viewers, watch time, chat activity, and retention. If only the public counter changed, timing or counting behavior may explain it. If engagement indicators also weakened, examine stream quality, pacing, content, and promotion.

    Creators also ask whether watching their own stream changes the reported figure. The answer depends on the platform and reporting context, so consult this explanation of whether YouTube counts your own views instead of inferring an answer from the public counter. Then judge the number by its business trail: clicks, leads, and sales carry more decision-making value than a counter that merely moved.

    Read fluctuations as patterns. One refresh is anecdotal. Repeated behavior across streams is evidence you can act on.

    Why Live View Count Matters for Discovery and Revenue

    A stream can show a crowded counter while producing few clicks, leads, or sales. Another broadcast may attract fewer concurrent viewers yet reach people who need the offer and are ready to act. Live view count matters because people must enter before any business result can occur, but entry is only the first checkpoint.

    YouTube now counts a view from the first frame of playback across long-form videos, Shorts, podcasts, and live streams, while analytics keeps a separate engaged views metric. Forbes' coverage of the YouTube view-count change highlights the practical distinction: the public number can increase early, while engaged viewing gives a clearer indication that someone continued watching.

    A modern laptop displaying a live streaming analytics dashboard next to a smartphone showing a creator's live video.

    Read performance as a funnel, like a shop where each doorway leads to a deeper commitment:

    • Entry: Did people start playback or enter the broadcast?
    • Attention: Did they stay long enough to understand the content?
    • Interaction: Did they comment, answer a poll, ask a question, or subscribe?
    • Intent: Did they click an offer, visit a booking page, or request information?
    • Outcome: Did they become a lead or customer?

    The raw count measures the doorway. Revenue usually depends on what happens after people walk through it.

    Connect the stream to a measurable action

    Give viewers one clear next step, such as a product link, consultation form, course page, or event registration. Create a distinct trackable link for the broadcast and place it where viewers can find it in the description, chat, or related posts.

    ViewsMax can create trackable offer links and connect clicks, leads, and attributed sales to the content that generated them. You can then compare audience size with commercial response, rather than treating concurrent viewers as a substitute for revenue.

    This changes content decisions. A modest peak can outperform a larger broadcast when it attracts the right audience and presents a relevant reason to act. A high live view count may show that promotion worked, while saying little about whether viewers understood or wanted the offer.

    The video below presents another way to connect content activity with measurable performance.

    Use public views to assess distribution, engaged views and retention to assess attention, and attribution data to assess business impact. Sponsorship discussions, content planning, and budget decisions become clearer when these layers remain separate.

    Actionable Strategies to Grow and Retain Live Viewers

    Growing a live audience isn't only about attracting more people at the start. You also need to give viewers a reason to stay, participate, and return for the next broadcast.

    Before the stream

    Start promotion early enough for the event to become part of your audience's plans. Announce the topic, promise a specific outcome, and make the start time easy to find. A vague message such as “I'm going live soon” gives people little reason to rearrange their attention.

    Use a short teaser clip to show the question, mistake, demonstration, or result that the broadcast will address. Share the clip on your other channels, then repeat the reminder close to the start. If you publish on a consistent schedule, viewers can build the habit without needing to rediscover your broadcast each time.

    A list of actionable strategies for content creators to effectively grow and retain live stream viewers.

    During the broadcast

    The first moments should orient viewers who arrive late. State the topic, explain what they'll get, and tell them when the most important segment is coming. Don't spend the opening in technical silence while people wait for the host to begin.

    Then create participation points:

    • Ask focused questions: Invite viewers to choose between clear options rather than requesting general comments.
    • Use polls and Q&A: Interactive prompts give passive viewers a low-friction way to participate.
    • Acknowledge useful contributions: Respond to questions by name when appropriate, then connect the answer to the wider lesson.
    • Repeat the core offer: Latecomers need the context and call to action that earlier viewers heard.

    Pacing protects retention. Prepare transitions, switch visual elements when the topic changes, and remove dead air wherever possible. A recurring segment can also give returning viewers a reason to attend live instead of waiting for the replay.

    After the stream

    Review the retention graph and identify where viewers left, stayed, or became active. Match those moments against your outline. A long drop during setup may signal that the opening needs tightening, while a sustained section around a demonstration can guide your next broadcast.

    Repurpose strong moments into clips and short-form posts. Each clip should have its own context and a clear invitation to the next live event. Don't merely publish a highlight. Explain why the moment matters and what viewers can expect if they attend the full broadcast.

    Retention is a programming tool. Use audience drop-off points to redesign the next stream, not to criticize the last one.

    A repeatable cycle looks like this:

    1. Schedule the event and publish a specific promise.
    2. Promote a teaser that creates a useful question.
    3. Open with orientation and immediate value.
    4. Build interaction into the outline.
    5. Deliver one clear action for interested viewers.
    6. Study retention and conversions after the broadcast.
    7. Turn the strongest segment into promotion for the next event.

    Building a Live Stream Monitoring Framework

    A useful monitoring framework combines reach, attention, participation, and revenue. It prevents the live view count from dominating the review because it's the easiest figure to see.

    Start with the audience picture. Record total live views, concurrent viewers, peak concurrent viewers, and unique viewers where the platform provides them. Keep the platform and reporting time beside each metric, especially when you publish across YouTube, Vimeo, or another service.

    Then examine attention. Review average watch time, retention patterns, and engaged views. Ask whether the audience stayed through the explanation that mattered most. A peak audience during an entertaining opening may be less valuable than steady attention during the section that explains the product or solves the viewer's problem.

    A post-stream review checklist

    • Audience timing: Did the largest simultaneous audience appear during the intended key moment?
    • Retention: Where did viewers leave, and what was happening on screen?
    • Participation: Which questions, polls, or demonstrations produced the strongest response?
    • Action: Did viewers click the designated link or complete the next step?
    • Commercial result: Did the broadcast generate leads, bookings, or sales that can be attributed to it?
    • Platform context: Are cross-platform figures based on comparable definitions?
    • Next adjustment: What single programming change should you test in the next stream?

    The wider market makes this discipline more important. Industry summaries based on Streams Charts data report roughly 120 billion hours of live content watched across major platforms in 2025, while another industry summary reports 36.4 billion hours of total live-streaming viewership in that year, compared with 37.1 billion hours at the pandemic peak in 2021. These summaries use different scopes, so they shouldn't be treated as interchangeable totals. The live-streaming market overview also reports that YouTube Live accounted for about 56 billion hours, around 47% of the market, with TikTok Live near 35 billion hours and Twitch around 18 billion hours in 2025.

    Large attention markets create more opportunities, but they also make vanity reporting easier. For teams selling software or services, a resource such as SaaS analytics strategy by Prometheus Agency can help frame the broader measurement problem around acquisition, activation, and revenue rather than isolated traffic totals.

    For a practical reference on interpreting channel performance, review YouTube view statistics, then build your own stream report with the same definitions every time. The goal isn't to eliminate every discrepancy. It's to make each decision from a consistent chain of evidence, from viewer entry to business outcome.


    Use ViewsMax to create trackable offer links, publish your live content across channels, and connect every click, lead, and sale to the stream that generated it. Start measuring your broadcasts as revenue channels, not just counters, so your next content decision reflects what converts.

  • How to Earn Money from a YouTube Channel: Top 2026 Tips

    How to Earn Money from a YouTube Channel: Top 2026 Tips

    Most advice on how to earn money from a YouTube channel starts and ends with AdSense. That's a weak business plan. Platform advertising can provide a useful base, but a durable channel turns attention into several measurable outcomes, including sponsorship revenue, affiliate commissions, product sales, memberships, and qualified leads. The central question isn't “How many views did this video get?” It's “What did those views produce?”

    A profitable channel therefore needs two systems working together. You need YouTube's native monetization features, and you need an attribution process that connects specific videos to clicks, customers, and revenue. Views create opportunity, but tracking tells you where the opportunity exists.

    The First Gate: Qualifying for YouTube's Native Monetization

    YouTube Partner Program approval is a distribution advantage, not a business result. Before your channel can use YouTube's advertising and fan-funding features, it must qualify for the YouTube Partner Program, commonly called YPP. The standard route to direct ad and YouTube Premium revenue sharing requires 1,000 subscribers plus either 4,000 qualified public watch hours during the last 12 months or 10 million qualified Shorts views during the last 90 days, according to YouTube's current monetization guidance and the reported 2026 threshold update. Shorts views do not count toward the 4,000-hour long-form requirement. They are separate qualification paths.

    A person using a laptop to view the YouTube Studio monetization page with progress tracking subscriber requirements.

    YouTube also announced an updated path for new applicants in August 2026, requiring 1,000 subscribers plus 8,000 public watch hours or 20 million Shorts views for the latest partner-program expansion. Requirements can change, so check the Earn tab in YouTube Studio before using a specific threshold in your forecast. Treat the displayed eligibility criteria as the current operating requirement.

    Prepare the account before applying

    Eligibility is an operating checklist, not the point where revenue begins. Review the channel for reused material, copyright problems, misleading metadata, and content that may fail YouTube's monetization policies. A channel can reach the required audience milestones and still encounter review problems if its library lacks original, advertiser-suitable content.

    Set up an approved Google AdSense account when YouTube Studio requests it. Use accurate payment and tax information, then complete every verification step. Account delays can prevent a technically eligible channel from receiving payouts, so handle this work before meaningful revenue accumulates.

    For a practical setup walkthrough, follow this guide on how to enable YouTube monetization. Use it alongside the instructions shown in your own YouTube Studio account, since the platform's eligibility and setup screens determine what applies to your channel.

    Activate the features that fit your format

    After approval, open the monetization settings and review each feature separately.

    • Watch-page ads: Enable advertising on eligible long-form videos, then assess individual videos instead of applying every placement without considering viewer experience.
    • Shorts revenue sharing: Treat Shorts as a separate revenue model. Its pooled advertising system operates differently from watch-page advertising.
    • Channel Memberships: Offer recurring benefits that are simple to deliver, such as member-only posts, private discussions, or early access.
    • Super Chat and Super Stickers: Use these during live streams, where viewers can pay for participation, recognition, or direct attention.
    • Super Thanks: Give viewers a direct way to support published videos without waiting for a live broadcast.

    Standard long-form ad revenue is generally split 55% to the creator and 45% to YouTube, while Shorts creators receive 45% of the allocated advertising portion under the pooled Shorts model, as explained in YouTube's official revenue-sharing documentation. That difference should shape your publishing plan. Long-form videos can combine watch-page revenue with deeper audience trust, while Shorts can introduce new viewers who later convert through other offers.

    Practical rule: Apply for native monetization, then measure the revenue it produces. YPP gives you access to tools. Your broader business model determines their value.

    Building Your Income Portfolio Beyond AdSense

    AdSense is useful, but it shouldn't carry the entire business. A channel becomes more resilient when every major content theme has a logical next step, such as a relevant product recommendation, a sponsor integration, a paid resource, or a membership benefit.

    The right portfolio depends on your audience's intent. A product-review channel can often begin with affiliate links. A consultant or educator may earn more from a workshop, course, or service. A broad entertainment channel may have stronger options in sponsorships, memberships, merchandise, and live participation.

    Revenue Stream Typical Audience Size Income Potential Setup Effort
    Brand sponsorships An engaged niche audience High, especially through recurring partnerships Medium
    Affiliate marketing Viewers with purchase intent Performance-based and scalable Low to medium
    Merchandise A loyal community Moderate to high, depending on demand and margins Medium to high
    Digital products Viewers seeking a defined result High margin and closely tied to expertise High
    Memberships and live support A committed returning audience Recurring and community-driven Medium

    Sponsorships create larger individual transactions

    A one-off integration pays for a deliverable. A long-term partnership can give the brand a dependable place in your content calendar and give you more predictable income. Start by identifying companies that already serve the problem your audience is trying to solve. Relevance matters more than prestige because a mismatched sponsor can reduce trust and weaken future conversions.

    Your proposal should describe the audience, the content environment, the deliverable, the distribution plan, and the reporting you'll provide. Don't sell raw exposure alone. Sell a credible path to awareness, consideration, trial, or purchase.

    Affiliates turn recommendations into performance revenue

    Affiliate marketing works when the product fits the video so naturally that the recommendation improves the viewer's next step. Demonstrate the product, explain who should use it, disclose the relationship clearly, and send viewers to a trackable destination.

    Independent benchmarks suggest description-link click-through rates of about 0.5% to 3% of video views, while affiliate revenue can represent 10% to 30% of total brand-deal income for established mid-tier creators, according to benchmarks for YouTube influencer and affiliate activity. These figures are benchmarks, not guarantees. Your topic, audience intent, offer, placement, and landing page determine the result.

    Shorts can support this system by introducing a product or problem, but the conversion path must remain clear. For format-specific ideas, review how to make money on YouTube Shorts. If your channel has a strong recurring format, you can also repurpose episodes into audio. This guide to turning a YouTube channel into a podcast offers useful context for extending your content into another distribution channel.

    Products and merchandise deepen ownership

    Merchandise works best when it expresses an inside reference, identity, or practical need that already exists in the community. Don't begin with a warehouse of inventory. Test demand with a small, focused range, and calculate production, fulfillment, refunds, platform fees, and customer support before setting a price.

    Digital products offer a different trade-off. A course, template, ebook, or paid workshop can convert expertise into an owned asset, but it requires a clear promise and customer support. Build it from repeated questions in comments, livestreams, and emails. A product that solves one specific problem usually sells more clearly than a broad library of information.

    The Art of the Pitch Securing High-Value Brand Deals

    Brands rarely choose a creator because of subscriber count alone. They want a credible audience, a safe content environment, a clear audience fit, and evidence that the creator can deliver professionally. Your job is to make those factors easy to evaluate.

    Choose partners before writing the email

    Create a prospect list from products you already use, companies your viewers mention, and businesses serving the same problem as your channel. Study the brand's existing creator campaigns, landing pages, customer language, and content restrictions. Then identify the person responsible for influencer partnerships, content marketing, or creator relations instead of sending an unpersonalized message to a general inbox.

    Your media kit should answer practical questions quickly:

    • Audience profile: Explain who watches, what they care about, and what buying context surrounds your videos.
    • Content examples: Link to relevant videos that demonstrate your presentation style and audience response.
    • Available deliverables: List integrations, dedicated videos, live mentions, community posts, or cross-platform packages.
    • Measurement plan: Describe how you'll report publication, clicks, engagement, or other agreed outcomes.
    • Commercial terms: State that usage rights, exclusivity, revisions, and payment terms require separate agreement.

    A six-step checklist infographic illustrating the process of securing and managing successful brand deals as a creator.

    A 2025 creator-economy report found that 62% of creators said they earned more from brand partnerships than from ad revenue, compared with 41% in 2023, as reported by InfluenceFlow's creator monetization analysis. That shift makes proactive outreach worthwhile, particularly for channels with a well-defined niche and a professional sales process.

    Use a pitch that makes the next step easy

    Your email should be brief, specific, and built around mutual fit. Adapt this template rather than copying it without research:

    Subject: Partnership idea for [Brand] and [Channel]

    Hi [Name],

    I run [Channel], where I help [specific audience] with [specific topic or outcome]. I'm reaching out because [Brand] fits the way my viewers already think about [relevant problem or use case].

    A recent video about [topic] shows how I explain this subject and how viewers respond to practical recommendations. I'd like to propose [specific deliverable], with [brief description of integration and viewer benefit]. I can also provide [trackable link, campaign recap, or additional placement] so we can evaluate the response.

    Would you be open to a short conversation about the campaign objective, deliverables, timing, and usage terms? I've attached my media kit with audience information and relevant examples.

    Best,
    [Name]
    [Channel]
    [Contact details]

    Don't promise sales you can't control. Promise a well-matched audience, strong execution, transparent reporting, and a clear process. After the campaign, send the agreed report promptly, ask for feedback, and record what the brand valued. That record becomes evidence for the next pitch and a foundation for a renewal.

    Optimizing Your Channel for Maximum Revenue

    Revenue optimization starts with audience value, not video length by itself. CPM describes advertiser cost around ad impressions, while RPM is closer to what the creator earns per 1,000 views after the relevant revenue factors. Both vary with niche, geography, format, audience behavior, and the commercial intent surrounding the content.

    Industry benchmarks place long-form creator RPM at roughly $1.65 to $25 per 1,000 views, while Shorts are estimated at about $0.02 to $0.12 RPM, according to creator-economy RPM benchmarks. On that benchmark range, one million long-form views could generate $1,650 to $24,750, while one million Shorts views could generate $20 to $120. These aren't promises. They illustrate why a view count without format and revenue context can mislead you.

    Improve the economics of long-form content

    Choose topics where viewers have a meaningful reason to act. A tutorial for a professional tool, a detailed comparison, or a solution-led review can support advertising, affiliates, sponsorships, and products at the same time. The topic should serve the viewer first, but its commercial context should be clear before you spend time producing it.

    Watch time matters because a viewer who stays longer has more opportunity to understand the idea, trust the presenter, and encounter an appropriate monetization point. Build the video around a clear promise, show progress early, remove repeated explanations, and place the most useful proof before the conclusion. Longer videos only help when the additional minutes earn attention.

    Use YouTube Analytics to compare audience retention, returning viewers, traffic sources, RPM, clicks, and downstream actions. Publishing at a time your audience is available can help the initial distribution, and this guide to maximizing YouTube views for creators provides planning context. Timing won't rescue an unclear title or weak opening, so treat it as a supporting variable.

    Give Shorts a defined job

    Shorts can be valuable even when their direct payout is modest. Use them to test hooks, introduce a recurring problem, answer one narrow question, and point interested viewers toward a related long-form video or offer. The handoff must be explicit. A viewer who watches a Short should know what to do next.

    A useful content chain might begin with a Short showing a common mistake, continue with a long-form tutorial explaining the fix, and finish with a trackable resource or product recommendation. This approach treats Shorts as discovery and long-form as deeper engagement and revenue capture.

    For broader search and packaging improvements, use these YouTube SEO optimization tips. Focus on the promise in the title and thumbnail, the answer delivered in the video, and the next action connected to the viewer's intent. Don't optimize keywords in isolation from the buying or learning journey.

    Audience-depth test: If a video attracts attention but gives viewers no relevant next step, it may be growing the channel without building the business.

    From Views to Sales: Measuring What Works

    Views measure exposure. Sales measure business results. The gap between them is an observable sequence: a viewer notices a recommendation, clicks a link, reaches the offer, and completes an action. Tracking that sequence shows whether a video merits another production cycle or delivered reach without commercial value.

    Give each important content asset its own trackable destination. Use separate links for a tutorial, review, livestream, and Short, even when they promote the same offer. Record the video title, publication date, topic, placement, offer, clicks, leads, sales, commissions, refunds, and net revenue. This record lets you compare content by attributable return rather than audience size alone.

    Description-link performance varies by channel, so treat any outside benchmark as a diagnostic prompt rather than a target. Your own conversion data matters more. Separate formats in revenue analysis because long-form watch-page advertising and Shorts revenue use different sharing structures, as noted earlier.

    Build a repeatable attribution workflow

    Put the call to action where viewers have enough context to care. An offer at the end may suit a warm audience, while a tutorial may perform better when its relevant resource appears immediately after the problem is demonstrated. Keep one primary action per video where possible, and state exactly what the viewer receives after clicking.

    ViewsMax can create trackable links, connect clicks, leads, and sales to the content that generated them, and organize publishing and performance data in one dashboard. Use it with your affiliate platform, store, course checkout, or customer relationship system. It should support those systems, not replace their transaction records.

    The video below offers another practical way to connect published content with measurable performance.

    Review revenue per video, revenue per click, lead quality, conversion rate, and production effort. A video with fewer views may deserve more investment if it generates qualified customers. A viral upload may need a clearer path to the offer before it produces meaningful revenue.

    Attribution also improves editorial decisions. Compare related videos by the action they generate, then preserve the topics, formats, and offers that produce profitable customers. If clicks are strong but sales are weak, inspect the landing page or offer. If views are high but clicks are scarce, revise the placement, promise, or call to action. Each result points to a different fix.

    Common Monetization Pitfalls and How to Avoid Them

    A creator can publish consistently, reach the YPP threshold, and still build a fragile business. The problems usually appear in the gap between audience growth and commercial design.

    Depending on one platform payout

    A channel owner watches monthly ad revenue fluctuate and responds by publishing more of the same content. That may increase workload without improving business stability. Advertising remains one income stream, but sponsorships, affiliates, products, memberships, and services can give the audience more ways to support the channel.

    Build the second stream before the first one becomes essential. Choose the option that matches existing viewer intent, then use relevant videos to test it. A finance educator might begin with a paid template, while a gear reviewer might begin with carefully selected affiliate recommendations.

    Mentioning an offer without giving viewers a reason to click

    “Check the link below” is not a persuasive call to action. It doesn't tell viewers what they'll receive, who it's for, or why they should act now.

    Replace it with a concrete instruction: explain the resource, connect it to the problem in the video, and make the destination easy to identify. Keep the link near the top of the description when it's the primary next step, and use a distinct tracking link so you can evaluate the result.

    Chasing unrelated viral topics

    A creator sees a trend outside the channel's subject, publishes a rushed response, and attracts viewers who never return for the core content. The view count looks positive, but the audience fit weakens and the commercial path becomes harder to define.

    Use trends only when they reveal something useful to your existing audience. Adapt the topic to your established promise, or treat it as an experiment with a clear success criterion beyond reach.

    Underpricing sponsorships

    A creator accepts the first offer without discussing usage rights, exclusivity, revisions, placement, or reporting. The sponsor gains broader access than expected, while the creator absorbs extra work without matching compensation.

    Separate the creative deliverable from the rights attached to it. Ask what the brand can reuse, where it can run the content, how long the agreement lasts, and whether competitors are restricted. Put every agreed term in writing before production begins.

    Commercial discipline: Never evaluate a sponsorship only by the fee. Evaluate the work required, the rights granted, the audience fit, and the opportunity cost of occupying that publishing slot.

    Publishing without learning from the result

    Some creators review views and likes, then immediately plan the next upload. That routine misses the information that makes growth more efficient. Compare the topic, format, audience retention, calls to action, clicks, leads, sales, and net revenue across videos.

    The goal isn't to turn every upload into a sales pitch. It's to understand which videos attract the right viewers, which ones build trust, and which ones produce measurable business outcomes. Once you know that pattern, you can create more deliberately and stop rewarding empty reach.


    ViewsMax helps creators plan content, publish across channels, and track clicks, leads, and sales back to the specific content that generated them. Visit ViewsMax to connect your YouTube publishing decisions with attributable revenue and identify which videos are selling.

  • How Much Does YouTube Pay for Shorts in 2026

    How Much Does YouTube Pay for Shorts in 2026

    Shorts commonly earn roughly $0.03 to $0.10 per 1,000 views, and YouTube allocates 45% of Shorts revenue to creators while retaining 55%. That headline range isn't a fixed rate, though, because Shorts earnings depend on the shared ad pool, music licensing, audience geography, eligible view share, and what those viewers do after watching.

    You post a Short every day, one of them takes off, and the view counter climbs past two million. Then you open YouTube Studio expecting a dramatic payout and see only a modest balance. The result feels wrong until you understand that Shorts weren't designed like traditional videos, where an ad can be associated more directly with a particular upload.

    The better question isn't only how much does YouTube pay for Shorts. It's also what those views are worth when they introduce people to your channel, newsletter, product, service, affiliate offer, or long-form library. Shorts can produce weak direct ad revenue and still become an efficient discovery channel.

    What Shorts Actually Pay Per 1,000 Views

    A Short can pass a million views and still produce a payout that feels surprisingly small. Independent creator benchmarks commonly place Shorts RPM around $0.03 to $0.10 per 1,000 views, with some reports reaching as low as $0.01. The Hootsuite overview of YouTube Shorts monetization provides context for that benchmark range.

    Results vary by audience and content. U.S.-heavy audiences, finance or technology topics, and limited music licensing often support stronger RPMs. Broad entertainment and music-heavy Shorts commonly fall nearer the lower end because licensing and advertiser demand affect the amount available for distribution.

    At those benchmark levels, a million-view Short could generate roughly $30 to $100, before taxes, currency conversion, or other deductions. The basic estimate is:

    Estimated Shorts revenue = views ÷ 1,000 × Shorts RPM

    That formula helps with planning, but it does not describe a fixed price for each thousand views. Shorts ads run across the feed rather than attaching to one video in the same direct way as many long-form ads. YouTube combines the advertising revenue, accounts for music licensing, and allocates the remaining pool according to each creator's share of eligible Shorts views. The creator receives a portion of that allocation, while YouTube retains the rest, as described in YouTube's Shorts monetization documentation.

    Practical rule: Treat a Shorts RPM estimate as a planning range, not a promise attached to every thousand views.

    Shorts RPM at a glance

    Video format Typical RPM range Notes
    YouTube Shorts $0.03 to $0.10 per 1,000 views Pool-based allocation, affected by music, geography, eligible views, and advertiser demand
    Long-form YouTube video Qualitatively higher in many channels More direct ad placement and different monetization mechanics
    Music-heavy Short Often lower within the Shorts range Licensing can reduce the pool before creator allocation
    Finance or technology Short Can perform toward the higher end Audience intent and advertiser demand may support stronger payouts

    The more useful question is what those views do after the Short ends. Shorts are often a top-of-funnel format, helping new viewers discover a channel, newsletter, product, service, affiliate offer, or long-form library. A creator may earn little from the feed itself while gaining subscribers, email signups, product interest, affiliate clicks, or service inquiries.

    That is why Shorts can make business sense even with a low RPM. Long-form videos often work better for direct ad revenue and deeper viewing, while Shorts can supply reach and introduce people to offers that pay more than the initial view. Evaluate both outcomes before deciding whether a Short performed well.

    How Shorts Monetization Got Here

    A creator publishing Shorts in the early days could attract millions of views without seeing a consistent advertising payout. In August 2021, YouTube introduced the $100 million Shorts Fund, a bonus-style pool designed to reward creators whose Shorts gained attention. It encouraged participation, yet it did not connect every eligible channel's views to a clear advertising calculation.

    That difference shaped the next stage. A bonus could recognize selected creators, while a revenue-sharing system could follow advertising activity across the Shorts feed. As viewing grew, YouTube moved toward a model that treated Shorts more like a shared advertising marketplace than a promotional experiment.

    A timeline graphic showing the evolution of YouTube Shorts monetization from a creator fund to pool-based payouts.

    The move to revenue sharing

    In February 2023, YouTube introduced formal Shorts ad-revenue sharing. Advertising revenue from the Shorts feed entered a shared pool, music licensing was accounted for, and creator earnings were allocated according to eligible view share. Creators received 45% of their allocated revenue, replacing the discretionary structure of the earlier fund. The official YouTube help documentation describes this pool-based arrangement.

    The change made payouts repeatable, though not fixed. Earnings could vary with the size of the overall pool, a channel's eligible views, its audience mix, and whether its Shorts used music. Two channels with similar public view counts could therefore receive different results.

    That variability also explains why a single Shorts RPM is only a planning estimate. The system rewards participation in a large feed, but each creator's share depends on more than the view counter.

    From launch feature to meaningful channel revenue

    By March 28, 2024, YouTube said that more than 25% of channels in the YouTube Partner Program were earning through Shorts revenue sharing. YouTube also said Shorts averaged over 70 billion daily views at that time. The Business Insider reporting on early Shorts monetization documents these milestones and the early payout experience.

    The historical shift clarifies Shorts' role today. Monetization became more formal than the old bonus model, while the format remained built for broad distribution. A Short's value may come from its feed payout, but also from new subscribers, visits to long-form videos, leads, or sales that happen later.

    Shorts became easier to monetize, but not necessarily more valuable per view. Their strategic advantage remains distribution and audience entry.

    How YouTube Calculates Your Shorts Earnings

    A Short can attract a large audience while producing a modest direct payout. The reason is simple: YouTube does not attach a fixed payment to each upload. It collects advertising revenue from the Shorts feed, adjusts the available amount under its music-rights arrangements, and distributes the creator portion according to eligible view share.

    The calculation works in four stages:

    1. YouTube gathers Shorts advertising revenue. Ads appear between videos in the Shorts feed, and the related revenue enters a shared pool.
    2. Music licensing is accounted for. Shorts that use licensed music may send part of the available revenue toward the applicable rights arrangements.
    3. YouTube assigns the creator portion. Creators receive 45% of their allocated amount, while YouTube retains 55%, as explained in YouTube's explanation of Shorts revenue sharing.
    4. The creator portion follows eligible view share. Your allocation depends on your eligible Shorts views compared with the eligible activity represented in the wider pool.

    An infographic detailing the six-step process of how YouTube calculates and pays earnings for Short video content.

    A simplified pool example

    Suppose a hypothetical creator pool contains $10 million after advertising revenue has been gathered and music-related costs have been handled. YouTube does not divide that amount evenly across every raw view. It calculates each creator's share of eligible Shorts views, then applies the creator portion to that allocation.

    A channel contributing a larger share of eligible views receives a larger allocation. If the overall eligible-view volume is enormous, the same pool is divided across more activity. That is why Shorts RPM can remain only a few cents even when view counts look impressive.

    Music can change the result as well. Two Shorts with the same number of views may produce different earnings if one uses licensed music and the other uses original audio or a rights arrangement with different economics. A million views is therefore a reach milestone, not a universal payout unit.

    Creators should also separate RPM from CPM. RPM describes what the creator receives per thousand views after the relevant platform calculations, while CPM refers to an advertiser-facing cost metric. The guide explaining what CPM means on YouTube can help clarify that distinction. To compare the possible business value of traffic beyond the feed payout, try the Auspia traffic value calculator.

    The practical formula is:

    Estimated earnings = Shorts RPM × (eligible views ÷ 1,000)

    This formula estimates an outcome after the allocation mechanics have already shaped the RPM. It does not turn Shorts into a fixed-rate product. Studio data gives you a better planning base because it reflects your audience, category, music usage, and eligible-view mix. More importantly, Shorts can pay off through reach, subscribers, leads, or later sales when direct feed revenue is small.

    Who Qualifies for Shorts Revenue Sharing

    Shorts ad-revenue sharing isn't automatic for every creator who uploads vertical video. You generally need to be accepted into the YouTube Partner Program, be located where the relevant features are available, and meet YouTube's current eligibility and policy requirements.

    YouTube can adjust requirements and availability by region, so creators should verify the latest rules inside YouTube Studio and the YouTube Partner Program application guidance. Don't build a revenue forecast from an old screenshot or a threshold copied from another country.

    The qualification path

    The process usually includes several separate checks:

    • Reach the applicable audience threshold: YouTube evaluates the subscriber requirement and the relevant watch-hour or Shorts-view route for the features you're applying for.
    • Secure the account: Two-step verification helps satisfy account requirements and protects access to monetization tools.
    • Accept the revenue terms: Shorts creators must accept the terms that govern Shorts ad-revenue sharing.
    • Connect AdSense: An approved AdSense account is needed for payments through YouTube's monetization system.
    • Pass channel review: YouTube reviews content for originality, policy compliance, and suitability for monetization.

    Approval doesn't make every view payable. A channel can be inside the Partner Program while an individual Short receives limited or no eligible revenue because of policy issues, reused content, artificial engagement, or other restrictions.

    Common problems that delay or limit earnings

    Reused material is a frequent risk. Uploading another person's clip with minimal changes may not demonstrate enough original contribution, even if the edit includes a caption or a visual effect. Commentary, meaningful transformation, original presentation, and clear editorial value create a stronger foundation than simple reposting.

    Misleading metadata, unsafe demonstrations, and artificial engagement can also affect monetization. A sudden view count isn't useful if the traffic violates platform rules or fails to qualify as legitimate engagement.

    Views earned before monetization approval generally don't become retroactively payable. Check the monetization status for your channel and individual uploads in YouTube Studio before assuming that a high-performing Short has accumulated an unpaid balance.

    Shorts RPM Compared With Long-Form Video

    A Short can attract a million views and still earn less than a long-form video with a fraction of that reach. RPM helps explain why. It puts different view totals on the same basis, but it is an average outcome, not a guaranteed price. It also differs from CPM, which measures the advertiser-side cost rather than the creator's realized revenue.

    Shorts usually have a much lower RPM than long-form video. Shorts earnings come from a shared feed pool, while long-form videos can support more direct ad placement and different inventory conditions. Geography, topic, advertiser demand, seasonality, and viewer intent all affect the gap.

    A 2026 analysis of 274 mixed-format channels found that Shorts RPM was only 3% to 14% of long-form RPM in almost every niche. In those results, creators needed roughly 11,000 to 34,000 Shorts views to match the revenue from 1,000 long-form views. The findings appear in AIR Media-Tech's 2026 Shorts and long-form RPM analysis.

    A direct comparison

    Metric YouTube Shorts Long-form video
    Revenue structure Shared Shorts ad pool More direct video ad monetization
    Typical view economics Often around $0.03 to $0.10 RPM Commonly higher, depending on channel and audience
    Strongest strategic role Discovery, reach, subscriber entry, funnel activity Deeper viewing, stronger ad value, conversion support
    Main variables Eligible view share, music, geography, topic, pool size Ad inventory, watch time, topic, geography, viewer intent
    Best planning question What downstream action did the Short create? What revenue did this viewing session generate?

    The difference becomes clear in a simple comparison. One million Shorts views at $0.05 RPM produces about $50, while 100,000 long-form views at a hypothetical $5 RPM produces about $500. These are examples, not forecasts. Equal view totals can represent very different commercial value.

    Shorts can still win on reach. A brief clip may find viewers who would not click a long video from an unfamiliar creator. If those viewers continue to a detailed tutorial, email sequence, product page, or consultation, the Short's direct RPM becomes only one part of its return. For many creators, Shorts work as the discovery and lead-capture layer, while long-form carries more of the advertising and conversion load.

    Realistic Earnings With Example Calculations

    A Short can reach a million views and still produce less direct ad revenue than a smaller long-form video. Use the RPM range as a planning scenario, not a promise. The calculation is simple, while the inputs vary with audience location, music use, eligible views, advertiser demand, and the size of the shared pool.

    Scenario one, one million views

    At $0.03 RPM, one million views works out as:

    1,000,000 ÷ 1,000 × $0.03 = $30

    At $0.10 RPM, the same view count works out as:

    1,000,000 ÷ 1,000 × $0.10 = $100

    The $0.03 to $0.10 range is a benchmark, not guaranteed take-home income. YouTube's calculation depends on eligible activity within the Shorts system, so two channels with the same public view count can receive different estimates.

    Scenario two, a ten-million-view month

    Suppose a channel receives 10 million views across its Shorts in one month. At $0.05 RPM, the estimate is $500. At $0.08 RPM, it is $800.

    Scenario Shorts RPM Views Estimated revenue
    Lower-range month $0.03 1,000,000 $30
    Upper-range benchmark $0.10 1,000,000 $100
    Mixed-audience month $0.05 10,000,000 $500
    Stronger mixed-audience month $0.08 10,000,000 $800

    The spread reflects different audience and content conditions inside a pool-based system. A U.S.-heavy audience, a commercially valuable topic, limited music exposure, and stronger eligible-view performance can produce a different result from broad entertainment traffic.

    Scenario three, the long-form comparison

    At 100,000 qualified views, a Short earning $0.06 RPM would produce $6. A long-form video earning a hypothetical $5 RPM would produce $500.

    Scenario Shorts RPM Views Estimated revenue
    Shorts comparison $0.06 100,000 $6
    Long-form comparison $5 100,000 $500

    These examples exclude taxes, withholding, currency conversion, and applicable deductions. They also leave out the value of a Short that creates a subscriber, lead, or sale. That is why Shorts often make more sense as a reach and lead-capture layer than as an advertising paycheck by themselves.

    For your own baseline, export the last 30 days of qualified views and estimated revenue from YouTube Studio. Divide estimated revenue by qualified views, then multiply by 1,000. Your channel's RPM is more useful for forecasting than a generic range because it reflects your audience and format mix. Use it to judge whether Shorts are paying through ads, or whether their stronger return comes from sending viewers to a tutorial, email sequence, product page, or consultation.

    Factors That Move Your Shorts Pay Up or Down

    A Short can receive strong distribution and still produce a small AdSense payout. The result depends on who watches, what the video is about, how much licensed music is involved, and whether viewers keep watching. These variables affect either the value of eligible views or the number of eligible views your Short earns.

    Audience geography

    Advertiser demand differs by market, so viewer location can shift Shorts earnings substantially. U.S.-heavy audiences generally produce stronger advertising value than audiences concentrated in lower-demand markets. You cannot fully choose where viewers live, but you can make the content understandable and relevant to the audience you want.

    Language, examples, cultural references, titles, and posting context all influence who discovers the Short. Treat those choices as audience filters, not just packaging.

    Topic and advertiser intent

    Finance, technology, and business topics often attract more commercial interest than broad entertainment. The same view count can therefore produce different advertising value. That does not make comedy or gaming a poor choice. A sustainable format with a clear audience usually beats a higher-value topic you cannot produce consistently.

    Topic value also affects revenue beyond AdSense. A creator teaching software workflows may send viewers to an affiliate offer, software trial, or consulting service. That downstream result can matter more than a small change in Shorts RPM. For many creators, Shorts work best as the top of a path, not the entire business.

    Music and original audio

    Music usage affects the pool before the creator allocation. Music-heavy content can therefore fall toward the lower end of available benchmarks. The Miraflow breakdown of Shorts RPM and licensing estimates that a million-view music Short may generate only $15 to $30 net after licensing effects.

    Original narration, original sound design, or music used under a suitable arrangement gives you more control. It still does not guarantee a higher payout, because audience and eligible-view performance remain part of the calculation.

    Hook and retention

    The first seconds determine whether a viewer stays long enough to understand the promise. Continued viewing helps the Short remain competitive in the feed. Immediate swipes can limit distribution before RPM becomes meaningful.

    Open with the specific result, remove slow introductions, and make the payoff clear. Review early retention rather than guessing which line failed.

    Posting consistency and audience fit

    Consistency creates more chances to test topics, openings, and formats. Frequency alone does not raise payment, and publishing weak Shorts can consume production time without improving business results.

    Relevant subscribers may help a new upload find an initial audience. Subscribers do not receive a direct payment or guarantee reach, but a well-matched subscriber base can help move viewers from a Short to a longer video, email list, product, or service.

    For a focused 30-day test, track:

    • Geography: Compare audience locations with your channel RPM.
    • Audio: Separate original-audio Shorts from music-heavy uploads.
    • Topics: Group results by niche and viewer intent.
    • Openings: Review early retention and rewrite the first line.
    • Downstream actions: Measure clicks, signups, and long-form sessions, not only views.

    Creators who want more ideas can review how to make money on YouTube Shorts. The practical test is simple: improve the variables you control, then judge Shorts by the business outcome they create, including reach, leads, and sales rather than ad revenue alone.

    Turning Shorts Into Real Revenue With ViewsMax

    A Short can earn only a few dollars directly and still be responsible for valuable activity elsewhere. That's why a serious Shorts dashboard should place direct Shorts RPM beside downstream results, including long-form viewing, channel subscriptions, link clicks, leads, and sales.

    ViewsMax is designed for that attribution problem. It lets creators create trackable links for offers, place those links in descriptions, bios, and posts, and connect clicks, leads, and sales to the content that generated them. For a Shorts strategy, the useful question becomes less “How much did this Short earn in AdSense?” and more “What did this Short cause a viewer to do next?”

    A practical attribution setup

    Start by giving each campaign, offer, or content series a trackable destination. Use distinct links for different Shorts or content groups so the resulting traffic doesn't disappear into one undifferentiated total.

    Then pair the link data with YouTube Studio metrics:

    • Shorts views and RPM: Record the direct platform payout.
    • Long-form movement: Identify viewers who continue into deeper videos.
    • Subscriber activity: Watch whether the Short attracts the audience your channel serves.
    • Clicks and leads: Connect viewers with the offer, newsletter, booking page, or product.
    • Attributed revenue: Compare the money generated downstream with the Short's production cost.

    A dashboard organized this way can change your publishing decisions. A Short with a low RPM but strong click-through and lead quality may deserve more production attention than a high-view Short that creates no meaningful next step.

    Consider a hypothetical month in which a creator receives $4 in direct Shorts payout and attributes $220 in channel revenue to viewers who arrived through Shorts. The direct AdSense number looks disappointing in isolation. The combined view shows a discovery asset that helped create a much more valuable revenue path.

    That's the key use case for attribution. Shorts don't have to carry the entire business through feed advertising. They can introduce the right viewer, while long-form content, products, services, sponsorships, or email capture complete the commercial journey.


    ViewsMax helps creators connect content with measurable clicks, leads, and sales instead of judging Shorts only by RPM or view count. Visit ViewsMax to track which Shorts and other content contribute to revenue, then use that evidence to plan your next publishing cycle.